
 Yahoo Finance
 Yara International ASA's Dividend Analysis
Exploring the Sustainability and Growth of Yara International ASA's Dividends
Yara International ASA (YARIY) recently announced a dividend of $0.24 per share, payable on 2024-06-13, with the ex-dividend date set for 2024-05-30. As investors look forward to this upcoming payment, the spotlight also shines on the company's dividend history, yield, and growth rates. Using the data from GuruFocus, let's look into Yara International ASA's dividend performance and assess its sustainability.
What Does Yara International ASA Do?
This Powerful Chart Made Peter Lynch 29% A Year For 13 Years
How to calculate the intrinsic value of a stock?
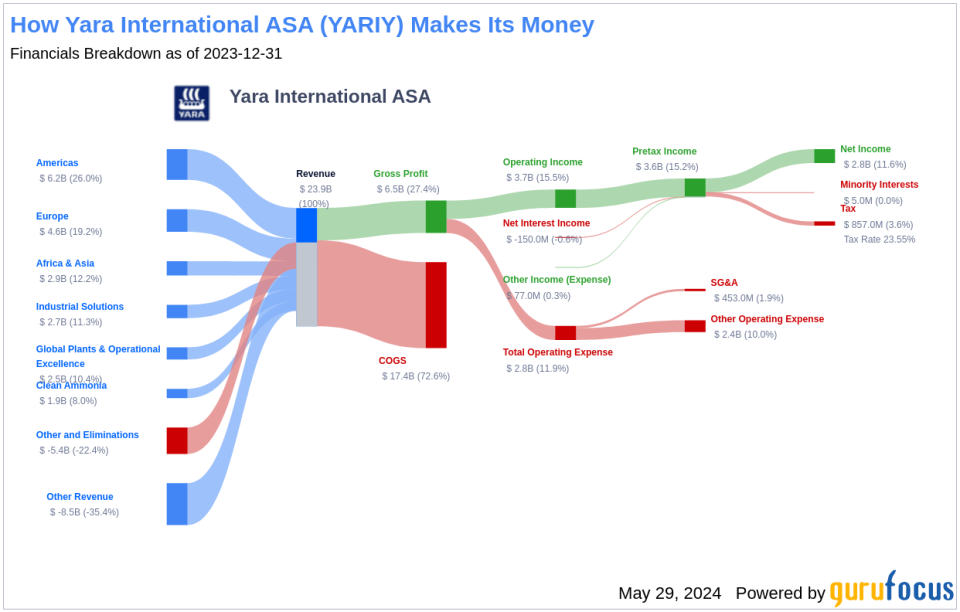
Yara International ASA is a crop nutrition company that converts natural gas into nitrogen products. It is engaged in the production of ammonia, mineral fertilizers, and industrial products. The firm also develops and markets environmental solutions and essential products for industrial applications. It markets and distributes a complete range of crop nutrition products and programs globally. The fertilizers and crop nutrition programs help to produce the food required for the growing world population. Industrial products and solutions reduce emissions, improve air quality, and support safe and efficient operations.
A Glimpse at Yara International ASA's Dividend History
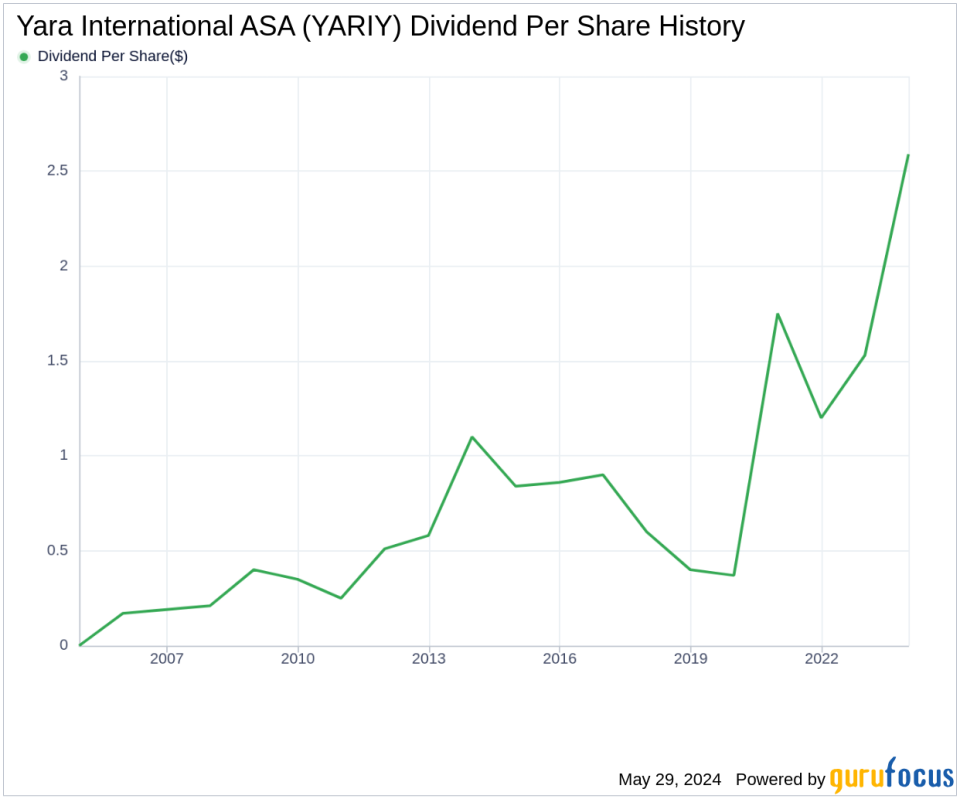
Yara International ASA has maintained a consistent dividend payment record since 2005. Dividends are currently distributed on a yearly basis. Below is a chart showing annual Dividends Per Share for tracking historical trends.
Breaking Down Yara International ASA's Dividend Yield and Growth
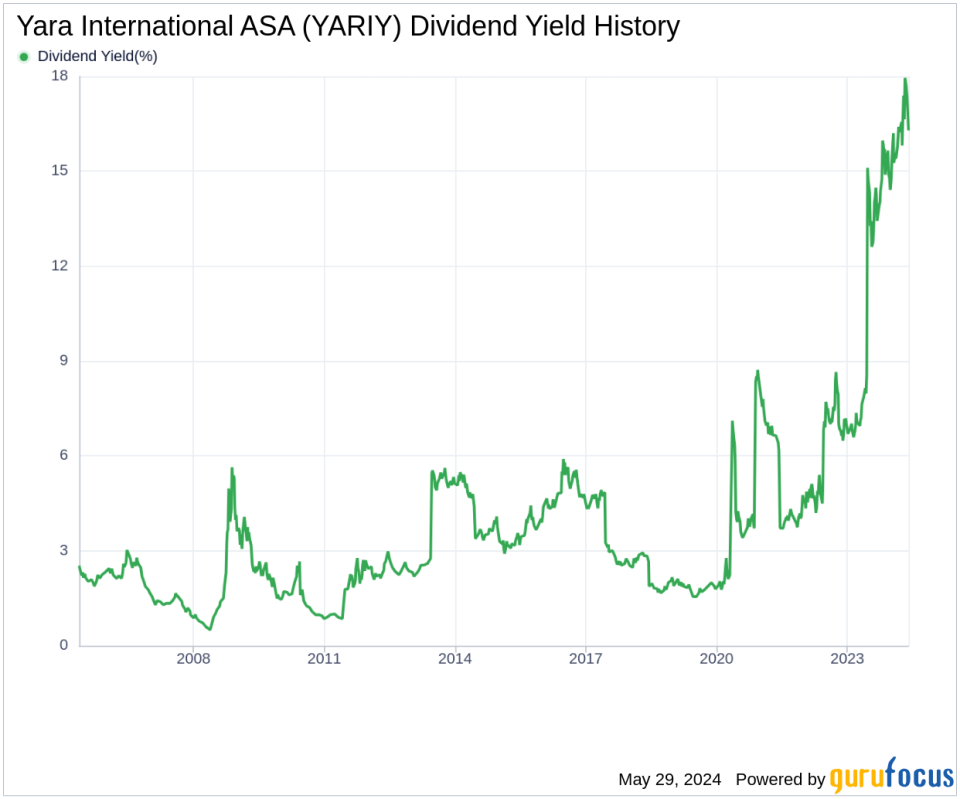
As of today, Yara International ASA currently has a 12-month trailing dividend yield of 16.28% and a 12-month forward dividend yield of 1.48%. This suggests an expectation of decreased dividend payments over the next 12 months. Over the past three years, Yara International ASA's annual dividend growth rate was 59.20%. Extended to a five-year horizon, this rate decreased to 55.50% per year. And over the past decade, Yara International ASA's annual dividends per share growth rate stands at an impressive 10.70%.
Based on Yara International ASA's dividend yield and five-year growth rate, the 5-year yield on cost of Yara International ASA stock as of today is approximately 148.02%.
The Sustainability Question: Payout Ratio and Profitability
To assess the sustainability of the dividend, one needs to evaluate the company's payout ratio. The dividend payout ratio provides insights into the portion of earnings the company distributes as dividends. A lower ratio suggests that the company retains a significant part of its earnings, thereby ensuring the availability of funds for future growth and unexpected downturns. As of 2024-03-31, Yara International ASA's dividend payout ratio is 23.10, suggesting that the company's dividend may not be sustainable.
Yara International ASA's profitability rank, offers an understanding of the company's earnings prowess relative to its peers. GuruFocus ranks Yara International ASA's profitability 7 out of 10 as of 2024-03-31, suggesting good profitability prospects. The company has reported positive net income for each of year over the past decade, further solidifying its high profitability.
Growth Metrics: The Future Outlook
To ensure the sustainability of dividends, a company must have robust growth metrics. Yara International ASA's growth rank of 7 out of 10 suggests that the company's growth trajectory is good relative to its competitors.
Revenue is the lifeblood of any company, and Yara International ASA's revenue per share, combined with the 3-year revenue growth rate, indicates a strong revenue model. Yara International ASA's revenue has increased by approximately 19.30% per year on average, a rate that outperforms approximately 70.31% of global competitors. The company's 3-year EPS growth rate showcases its capability to grow its earnings, a critical component for sustaining dividends in the long run. During the past three years, Yara International ASA's earnings increased by approximately -34.10% per year on average, a rate that outperforms approximately 9.5% of global competitors. Lastly, the company's 5-year EBITDA growth rate of 2.50%, which outperforms approximately 26.97% of global competitors.
Conclusion and Next Steps
Considering Yara International ASA's robust dividend history, attractive yield percentages, and solid financial health, the company presents itself as a viable option for dividend-seeking investors. However, the anticipated decrease in dividend payments and the challenges in maintaining high growth rates require careful consideration. Investors should keep an eye on the evolving financial landscape and the company's strategic responses to these challenges. GuruFocus Premium users can screen for high-dividend yield stocks using the High Dividend Yield Screener.
This article, generated by GuruFocus, is designed to provide general insights and is not tailored financial advice. Our commentary is rooted in historical data and analyst projections, utilizing an impartial methodology, and is not intended to serve as specific investment guidance. It does not formulate a recommendation to purchase or divest any stock and does not consider individual investment objectives or financial circumstances. Our objective is to deliver long-term, fundamental data-driven analysis. Be aware that our analysis might not incorporate the most recent, price-sensitive company announcements or qualitative information. GuruFocus holds no position in the stocks mentioned herein.
This article first appeared on GuruFocus.
