
 Yahoo Finance
 Applied Materials (AMAT) Q2 Earnings & Revenues Top Estimates
Applied Materials Inc. AMAT reported second-quarter fiscal 2024 non-GAAP earnings of $2.09 per share, surpassing the Zacks Consensus Estimate by 6.1%. Moreover, the figure improved 5% from the year-ago quarter’s reported number.
Net revenues of $6.65 billion were up 0.2% from the year-ago quarter. The figure surpassed the Zacks Consensus Estimate of $6.51 billion.
Strong momentum in the Applied Global Services (“AGS”) segment was a positive. Improving the Display segment contributed well. AMAT also experienced solid momentum across China and Southeast Asia in the reported quarter.
Shares of Applied Materials have gained 32.2% over a year, outperforming the industry’s rally of 26.3%.
However, softness in the Semiconductor Systems segment remained a headwind. Weakening momentum across Taiwan, Korea, the United States and Europe was a major negative.
Applied Materials, Inc. Price, Consensus and EPS Surprise
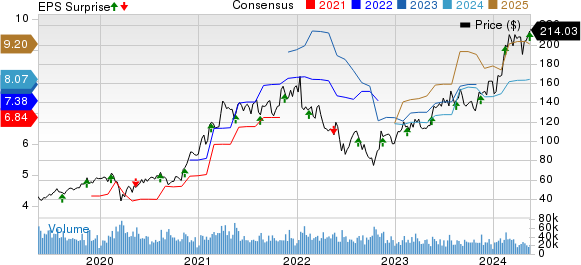
Applied Materials, Inc. price-consensus-eps-surprise-chart | Applied Materials, Inc. Quote
Segments in Detail
Semiconductor Systems generated revenues worth $4.9 billion, which contributed 73.7% to its net revenues, reflecting a decline of 1.5% from the year-ago quarter. The figure surpassed the Zacks Consensus Estimate of $4.8 billion.
AGS reported revenues of $1.53 billion (23% of net revenues), up 7.1% from the prior-year quarter. The figure surpassed the Zacks Consensus Estimate of $1.50 billion.
Revenues from Display and Adjacent Markets were $179 million (2.8% of net revenues), up 6.5% from the year-ago quarter. The figure beat the Zacks Consensus Estimate of $150 million.
Corporate and Other revenues were $36 million (0.5% of revenues), down 36.8% year over year.
Revenues by Geography
The United States, Europe, Japan, Korea, Taiwan, Southeast Asia and China generated revenues of $853 million, $289 million, $453 million, $988 million, $1.02 billion, $213 million and $2.83 billion, contributing 13%, 4%, 7%, 15%, 15%, 3% and 43% to net sales, respectively.
Revenues in Southeast Asia and China increased 35.7% and 101.5%, respectively, from the year-ago quarter. Revenues in the United States, Europe, Japan, Korea, Taiwan and Southeast Asia fell 23.4%, 39.4%, 1.5%, 37.6% and 28.9%, respectively, from the year-ago quarter.
Operating Results
The non-GAAP gross margin was 47.5%, which expanded 70 basis points (bps) from the year-ago quarter.
Operating expenses were $1.24 billion, up 4.9% from the year-ago quarter. As a percentage of sales, the figure expanded 90 bps from the year-earlier quarter to 18.7%.
The non-GAAP operating margin of 29% for the reported quarter contracted 10 bps year over year.
Balance Sheet & Cash Flow
As of Apr 28, 2024, cash, cash equivalent balances, and short-term investments were $7.6 billion, up from $7.5 billion as of Jan 28, 2024.
Inventories were $5.7 billion in second-quarter fiscal 2024 compared with $5.6 billion in first-quarter fiscal 2024. Accounts receivables increased to $4.8 billion in the reported quarter from $4.7 billion in the previous quarter.
The long-term debt was $5.463 billion at the end of the reported quarter compared with $5.462 billion at the end of the previous quarter.
Applied Materials generated a cash flow of $1.4 billion, down from $2.3 billion in the prior quarter.
AMAT returned $1.09 billion to its shareholders, of which share repurchases were worth $820 million and dividend payments amounted to $266 million.
Guidance
For third-quarter fiscal 2024, Applied Materials expects net sales of $6.65 billion (+/-$400 million). The Zacks Consensus Estimate for the same is pegged at $6.5 billion.
AMAT anticipates Semiconductor Systems, AGS and Display sales to be $4.80 billion, $1.57 billion and $245 million, respectively.
Applied Materials expects a non-GAAP gross margin of 47% and non-GAAP operating expenses of $1.26 billion. It projects a non-GAAP tax rate of 12.3%.
Management expects non-GAAP earnings per share of $1.83-$2.19. The Zacks Consensus Estimate for the same is pegged at $1.94.
Zacks Rank & Stocks to Consider
Currently, Applied Materials carries a Zacks Rank #3 (Hold).
Some better-ranked stocks in the broader technology sector are Salesforce CRM, CrowdStrike CRWD and Intuit INTU, each carrying a Zacks Rank #2 (Buy) at present. You can see the complete list of today’s Zacks #1 Rank (Strong Buy) stocks here.
Shares of Salesforce have gained 8.3% in the year-to-date period. The long-term earnings growth rate for CRM is 17.45%.
Shares of CrowdStrike have gained 32.8% in the year-to-date period. The long-term earnings growth rate for CRWD is projected at 22.31%.
Shares of Intuit have gained 4.8% in the year-to-date period. The long-term earnings growth rate for INTU is 14.57%.
Want the latest recommendations from Zacks Investment Research? Today, you can download 7 Best Stocks for the Next 30 Days. Click to get this free report
Salesforce Inc. (CRM) : Free Stock Analysis Report
Intuit Inc. (INTU) : Free Stock Analysis Report
Applied Materials, Inc. (AMAT) : Free Stock Analysis Report
CrowdStrike (CRWD) : Free Stock Analysis Report
