
 Yahoo Finance
 Berkeley Group Holdings (LON:BKG) Could Be Struggling To Allocate Capital
What trends should we look for it we want to identify stocks that can multiply in value over the long term? Ideally, a business will show two trends; firstly a growing return on capital employed (ROCE) and secondly, an increasing amount of capital employed. Put simply, these types of businesses are compounding machines, meaning they are continually reinvesting their earnings at ever-higher rates of return. In light of that, when we looked at Berkeley Group Holdings (LON:BKG) and its ROCE trend, we weren't exactly thrilled.
What Is Return On Capital Employed (ROCE)?
For those that aren't sure what ROCE is, it measures the amount of pre-tax profits a company can generate from the capital employed in its business. Analysts use this formula to calculate it for Berkeley Group Holdings:
Return on Capital Employed = Earnings Before Interest and Tax (EBIT) ÷ (Total Assets - Current Liabilities)
0.10 = UK£516m ÷ (UK£6.9b - UK£1.8b) (Based on the trailing twelve months to October 2023).
So, Berkeley Group Holdings has an ROCE of 10%. That's a relatively normal return on capital, and it's around the 9.5% generated by the Consumer Durables industry.
View our latest analysis for Berkeley Group Holdings
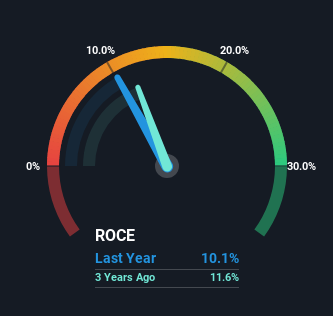
Above you can see how the current ROCE for Berkeley Group Holdings compares to its prior returns on capital, but there's only so much you can tell from the past. If you'd like, you can check out the forecasts from the analysts covering Berkeley Group Holdings for free.
The Trend Of ROCE
In terms of Berkeley Group Holdings' historical ROCE movements, the trend isn't fantastic. Over the last five years, returns on capital have decreased to 10% from 23% five years ago. On the other hand, the company has been employing more capital without a corresponding improvement in sales in the last year, which could suggest these investments are longer term plays. It may take some time before the company starts to see any change in earnings from these investments.
The Bottom Line On Berkeley Group Holdings' ROCE
In summary, Berkeley Group Holdings is reinvesting funds back into the business for growth but unfortunately it looks like sales haven't increased much just yet. Although the market must be expecting these trends to improve because the stock has gained 68% over the last five years. However, unless these underlying trends turn more positive, we wouldn't get our hopes up too high.
On a final note, we've found 1 warning sign for Berkeley Group Holdings that we think you should be aware of.
For those who like to invest in solid companies, check out this free list of companies with solid balance sheets and high returns on equity.
Have feedback on this article? Concerned about the content? Get in touch with us directly. Alternatively, email editorial-team (at) simplywallst.com.
This article by Simply Wall St is general in nature. We provide commentary based on historical data and analyst forecasts only using an unbiased methodology and our articles are not intended to be financial advice. It does not constitute a recommendation to buy or sell any stock, and does not take account of your objectives, or your financial situation. We aim to bring you long-term focused analysis driven by fundamental data. Note that our analysis may not factor in the latest price-sensitive company announcements or qualitative material. Simply Wall St has no position in any stocks mentioned.
