
 Yahoo Finance
 Brown & Brown (BRO) Hits a 52-Week High, Can the Run Continue?

Have you been paying attention to shares of Brown & Brown BRO? Shares have been on the move with the stock up 5% over the past month. BRO hit a new 52-week high of $28.63 in the previous session. Brown & Brown has gained 11.1% since the start of the year compared to the -0.9% move for the Finance sector and the 6.6% year-to-date return for its peer group.
What's Driving the Outperformance?
The stock has a great record of positive earnings surprises, having beaten the Zacks Consensus Estimate in each of the last four quarters. In its last earnings report on April 23, 2018, Brown & Brown reported EPS of $0.33 versus the Zacks Consensus Estimate of $0.29 while it beat the consensus revenue estimate by 1.93%.
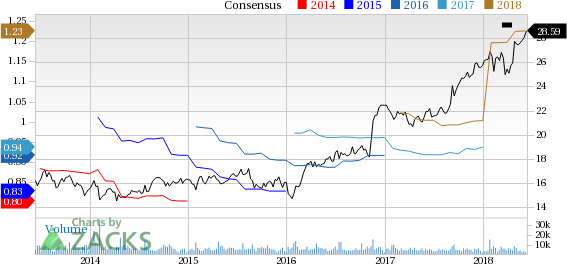
For the current fiscal year, Brown & Brown is expected to post earnings of $1.23 per share on $1.96 billion in revenues. This represents a 28.13% change in EPS on a 4% change in revenues. For the next fiscal year, the company is expected to earn $1.33 per share on $2.07 billion in revenues. This represents a year-over-year change of 8.64% and 5.67%, respectively.
Valuation Metrics
While BRO has moved to its 52-week high in the recent past, investors need to be asking, what is next for the company? A key aspect of this question is taking a look at valuation metrics in order to determine if the company is due for a pullback from this level.
On this front, we can look at the Zacks Style Scores, as these give investors a variety of ways to comb through stocks (beyond looking at the Zacks Rank of a security). These styles are represented by grades running from A to F in the categories of Value, Growth, and Momentum, while there is a combined VGM Score as well. The idea behind the style scores is to help investors pick the most appropriate Zacks Rank stocks based on their individual investment style.
Brown & Brown has a Value Score of D. The stock's Growth and Momentum Scores are A and B, respectively, giving the company a VGM Score of B.
In terms of its value breakdown, the stock currently trades at 23.3X current fiscal year EPS estimates. On a trailing cash flow basis, the stock currently trades at 20.5X versus its peer group's average of 11.8X. Additionally, the stock has a PEG ratio of 2.33. This isn't enough to put the company in the top echelon of all stocks we cover from a value perspective.
Brown & Brown, Inc. Price and Consensus
Brown & Brown, Inc. Price and Consensus | Brown & Brown, Inc. Quote
Zacks Rank
We also need to look at the Zacks Rank for the stock, as this supersedes any trend on the style score front. Fortunately, Brown & Brown currently has a Zacks Rank of #2 (Buy) thanks to rising earnings estimates.
Since we recommend that investors select stocks carrying Zacks Rank of 1 (Strong Buy) or 2 and Style Scores of A or B, it looks as if Brown & Brown fits the bill. Thus, it seems as though BRO shares could have a bit more room to run in the near term.
Want the latest recommendations from Zacks Investment Research? Today, you can download 7 Best Stocks for the Next 30 Days. Click to get this free report
Brown & Brown, Inc. (BRO) : Free Stock Analysis Report
To read this article on Zacks.com click here.
