
 Yahoo Finance
 Church & Dwight Co Inc's Dividend Analysis
Exploring the Dividend Performance and Sustainability of Church & Dwight Co Inc
Church & Dwight Co Inc (NYSE:CHD) recently announced a dividend of $0.28 per share, payable on 2024-06-03, with the ex-dividend date set for 2024-05-14. As investors look forward to this upcoming payment, the spotlight also shines on the company's dividend history, yield, and growth rates. Using the data from GuruFocus, let's look into Church & Dwight Co Inc's dividend performance and assess its sustainability.
What Does Church & Dwight Co Inc Do?
This Powerful Chart Made Peter Lynch 29% A Year For 13 Years
How to calculate the intrinsic value of a stock?
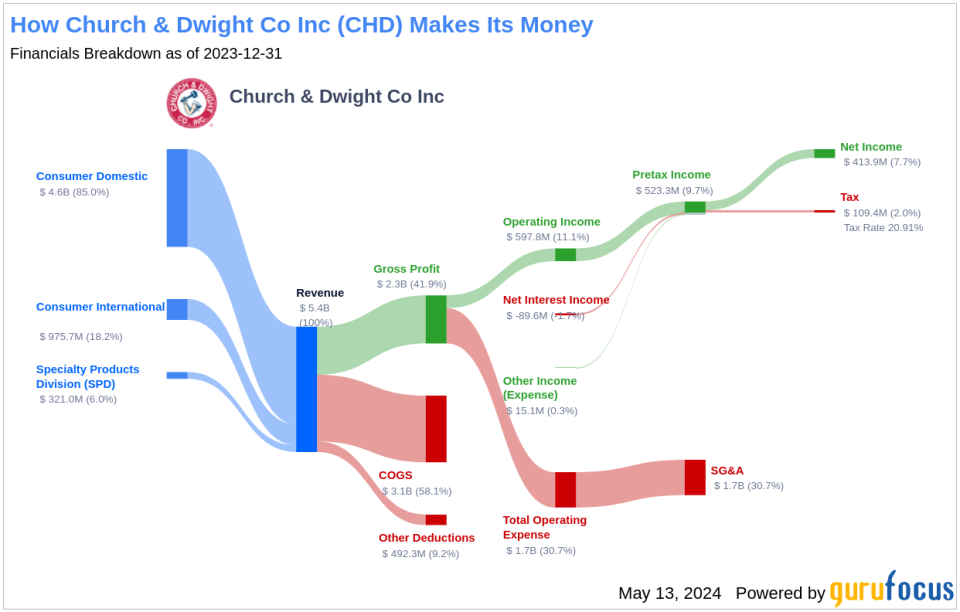
Church & Dwight is the leading global producer of baking soda. Beyond baking soda, the products in its portfolio have vast category reach, including laundry products, cat litter, oral care, deodorant, and nasal care, all sold under the Arm & Hammer brand. Its mix also includes Xtra, Trojan, OxiClean, First Response, Nair, L'il Critters/Vitafusion, Orajel, and WaterPik, which together with Arm & Hammer constitute around 70% of its annual sales and profits. And the firm added TheraBreath mouthwash and Hero pimple patches to its mix the past couple of years. Even as it works to extend the reach of its products, Church & Dwight still derives more than 80% of its sales from its home market in the US.
A Glimpse at Church & Dwight Co Inc's Dividend History
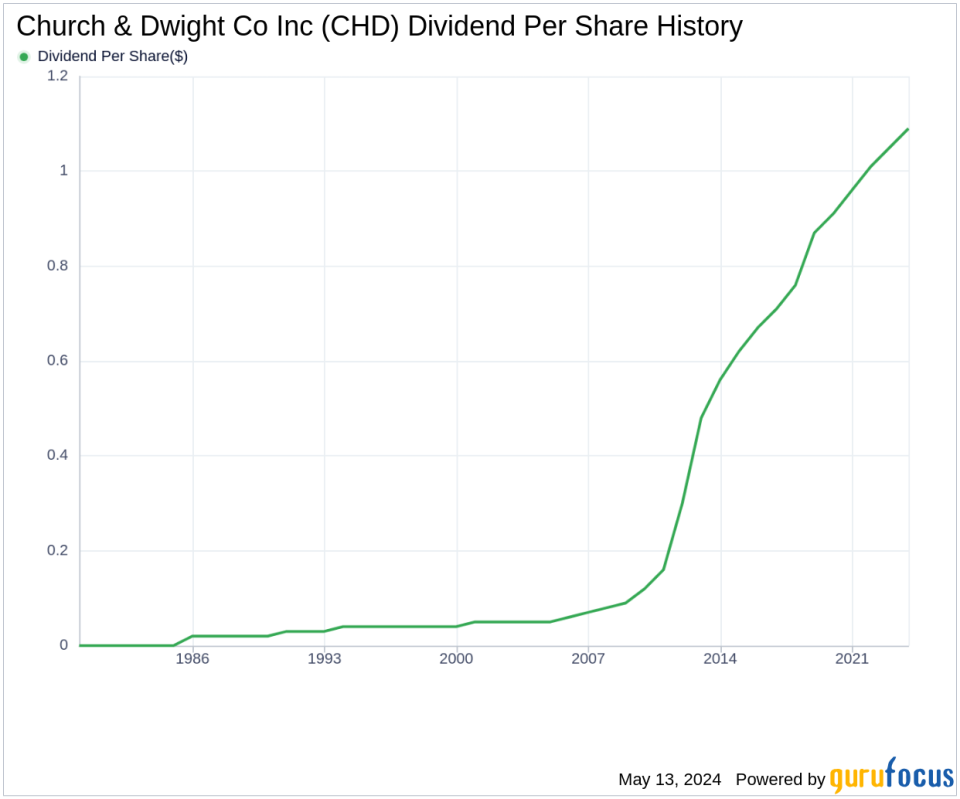
Church & Dwight Co Inc has maintained a consistent dividend payment record since 1985. Dividends are currently distributed on a quarterly basis. Church & Dwight Co Inc has increased its dividend each year since 1985. The stock is thus listed as a dividend aristocrat, an honor that is given to companies that have increased their dividend each year for at least the past 39 years. Below is a chart showing annual Dividends Per Share for tracking historical trends.
Breaking Down Church & Dwight Co Inc's Dividend Yield and Growth
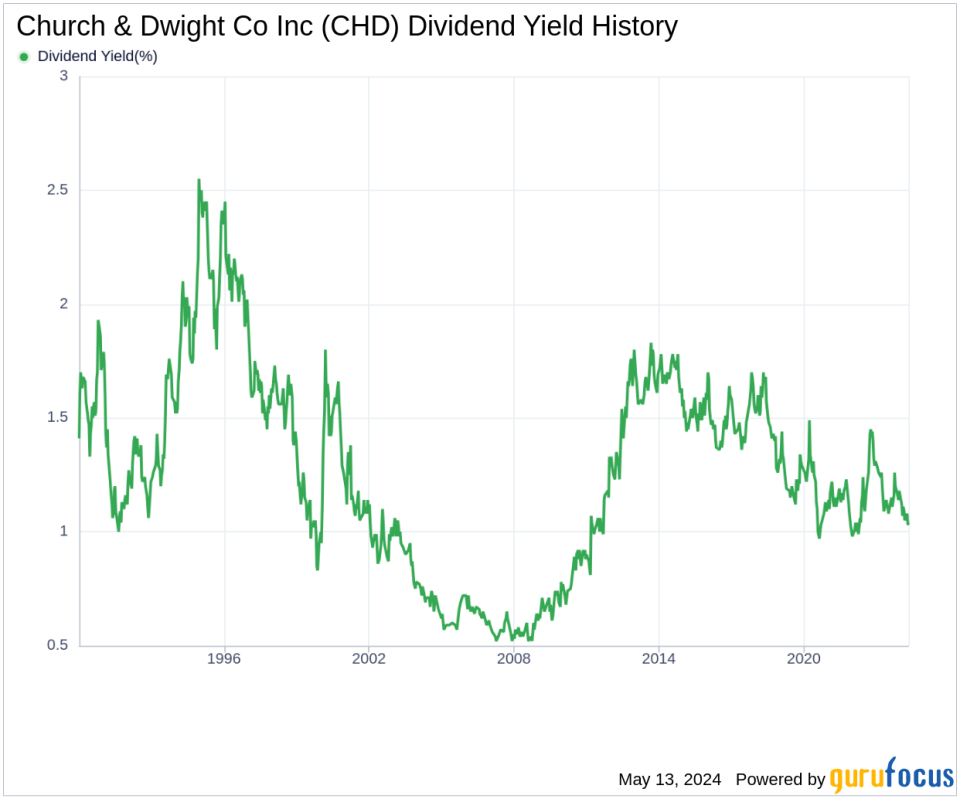
As of today, Church & Dwight Co Inc currently has a 12-month trailing dividend yield of 1.03% and a 12-month forward dividend yield of 1.06%. This suggests an expectation of increased dividend payments over the next 12 months. Church & Dwight Co Inc's dividend yield of 1.03% is near a 10-year low and underperforms than 81.22% of global competitors in the Consumer Packaged Goods industry, suggesting that the company's dividend yield may not be a compelling proposition for income investors.
Over the past three years, Church & Dwight Co Inc's annual dividend growth rate was 4.30%. Extended to a five-year horizon, this rate increased to 4.70% per year. And over the past decade, Church & Dwight Co Inc's annual dividends per share growth rate stands at 7.00%. Based on Church & Dwight Co Inc's dividend yield and five-year growth rate, the 5-year yield on cost of Church & Dwight Co Inc stock as of today is approximately 1.30%.
The Sustainability Question: Payout Ratio and Profitability
To assess the sustainability of the dividend, one needs to evaluate the company's payout ratio. The dividend payout ratio provides insights into the portion of earnings the company distributes as dividends. A lower ratio suggests that the company retains a significant part of its earnings, thereby ensuring the availability of funds for future growth and unexpected downturns. As of 2024-03-31, Church & Dwight Co Inc's dividend payout ratio is 0.34. Church & Dwight Co Inc's profitability rank, offers an understanding of the company's earnings prowess relative to its peers. GuruFocus ranks Church & Dwight Co Inc's profitability 9 out of 10 as of 2024-03-31, suggesting good profitability prospects. The company has reported positive net income for each of year over the past decade, further solidifying its high profitability.
Growth Metrics: The Future Outlook
To ensure the sustainability of dividends, a company must have robust growth metrics. Church & Dwight Co Inc's growth rank of 9 out of 10 suggests that the company's growth trajectory is good relative to its competitors. Revenue is the lifeblood of any company, and Church & Dwight Co Inc's revenue per share, combined with the 3-year revenue growth rate, indicates a strong revenue model. Church & Dwight Co Inc's revenue has increased by approximately 6.90% per year on average, a rate that underperforms than approximately 50.8% of global competitors.
The company's 3-year EPS growth rate showcases its capability to grow its earnings, a critical component for sustaining dividends in the long run. During the past three years, Church & Dwight Co Inc's earnings increased by approximately 0.60% per year on average, a rate that underperforms than approximately 58.48% of global competitors. Lastly, the company's 5-year EBITDA growth rate of 1.80%, which underperforms than approximately 58.07% of global competitors.
Next Steps
With a solid track record of dividend payments, a consistent history of dividend growth, and robust profitability metrics, Church & Dwight Co Inc presents a compelling case for investors seeking stable income through dividends. However, investors should also consider the company's relatively low dividend yield and mixed growth performance in their overall investment strategy. As always, it's essential to perform thorough research and consider all aspects of the company's financial health before making investment decisions. GuruFocus Premium users can screen for high-dividend yield stocks using the High Dividend Yield Screener.
This article, generated by GuruFocus, is designed to provide general insights and is not tailored financial advice. Our commentary is rooted in historical data and analyst projections, utilizing an impartial methodology, and is not intended to serve as specific investment guidance. It does not formulate a recommendation to purchase or divest any stock and does not consider individual investment objectives or financial circumstances. Our objective is to deliver long-term, fundamental data-driven analysis. Be aware that our analysis might not incorporate the most recent, price-sensitive company announcements or qualitative information. GuruFocus holds no position in the stocks mentioned herein.
This article first appeared on GuruFocus.
