
 Yahoo Finance
 COSOL Limited's (ASX:COS) Fundamentals Look Pretty Strong: Could The Market Be Wrong About The Stock?
With its stock down 8.5% over the past month, it is easy to disregard COSOL (ASX:COS). However, stock prices are usually driven by a company’s financial performance over the long term, which in this case looks quite promising. In this article, we decided to focus on COSOL's ROE.
Return on equity or ROE is a key measure used to assess how efficiently a company's management is utilizing the company's capital. Put another way, it reveals the company's success at turning shareholder investments into profits.
View our latest analysis for COSOL
How To Calculate Return On Equity?
The formula for return on equity is:
Return on Equity = Net Profit (from continuing operations) ÷ Shareholders' Equity
So, based on the above formula, the ROE for COSOL is:
16% = AU$5.5m ÷ AU$34m (Based on the trailing twelve months to June 2022).
The 'return' is the yearly profit. Another way to think of that is that for every A$1 worth of equity, the company was able to earn A$0.16 in profit.
What Is The Relationship Between ROE And Earnings Growth?
Thus far, we have learned that ROE measures how efficiently a company is generating its profits. Based on how much of its profits the company chooses to reinvest or "retain", we are then able to evaluate a company's future ability to generate profits. Assuming all else is equal, companies that have both a higher return on equity and higher profit retention are usually the ones that have a higher growth rate when compared to companies that don't have the same features.
COSOL's Earnings Growth And 16% ROE
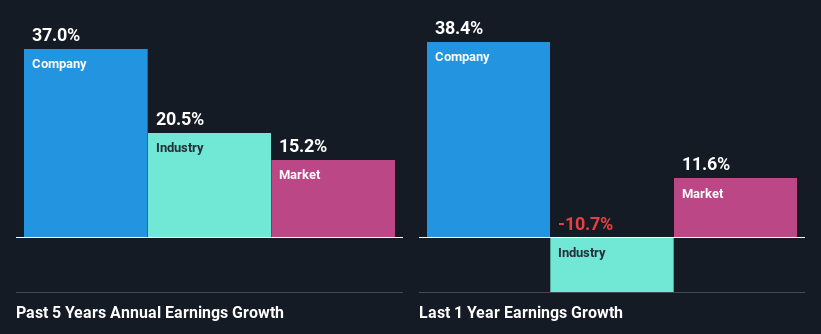
To start with, COSOL's ROE looks acceptable. Further, the company's ROE compares quite favorably to the industry average of 9.7%. Probably as a result of this, COSOL was able to see an impressive net income growth of 37% over the last five years. We reckon that there could also be other factors at play here. For example, it is possible that the company's management has made some good strategic decisions, or that the company has a low payout ratio.
As a next step, we compared COSOL's net income growth with the industry, and pleasingly, we found that the growth seen by the company is higher than the average industry growth of 20%.
Earnings growth is a huge factor in stock valuation. The investor should try to establish if the expected growth or decline in earnings, whichever the case may be, is priced in. Doing so will help them establish if the stock's future looks promising or ominous. Is COSOL fairly valued compared to other companies? These 3 valuation measures might help you decide.
Is COSOL Efficiently Re-investing Its Profits?
The high three-year median payout ratio of 51% (implying that it keeps only 49% of profits) for COSOL suggests that the company's growth wasn't really hampered despite it returning most of the earnings to its shareholders.
While COSOL has seen growth in its earnings, it only recently started to pay a dividend. It is most likely that the company decided to impress new and existing shareholders with a dividend.
Conclusion
On the whole, we feel that COSOL's performance has been quite good. In particular, its high ROE is quite noteworthy and also the probable explanation behind its considerable earnings growth. Yet, the company is retaining a small portion of its profits. Which means that the company has been able to grow its earnings in spite of it, so that's not too bad. Up till now, we've only made a short study of the company's growth data. So it may be worth checking this free detailed graph of COSOL's past earnings, as well as revenue and cash flows to get a deeper insight into the company's performance.
Have feedback on this article? Concerned about the content? Get in touch with us directly. Alternatively, email editorial-team (at) simplywallst.com.
This article by Simply Wall St is general in nature. We provide commentary based on historical data and analyst forecasts only using an unbiased methodology and our articles are not intended to be financial advice. It does not constitute a recommendation to buy or sell any stock, and does not take account of your objectives, or your financial situation. We aim to bring you long-term focused analysis driven by fundamental data. Note that our analysis may not factor in the latest price-sensitive company announcements or qualitative material. Simply Wall St has no position in any stocks mentioned.
Join A Paid User Research Session
You’ll receive a US$30 Amazon Gift card for 1 hour of your time while helping us build better investing tools for the individual investors like yourself. Sign up here
