
 Yahoo Finance
 Dow Jones 30 and NASDAQ 100 Price Forecast January 23, 2018, Technical Analysis
Dow Jones 30
The Dow Jones 30 initially rally during the trading session on Monday, reaching towards the 26,150 handle. If we can break above there, the market should continue to go much higher, and if we pull back at any time, that should be a buying opportunity as I see a bit of a “short-term floor” at the 26,000 level. I think that pullbacks will continue to attract a lot of attention, but quite frankly we have seen volume pick up on a large green candle, and that tells me we may not even get the pullback. When you look at the 4-hour chart, you could make an argument for an ascending triangle, or some type of ascending wedge. Either way, it looks like dips offer value, and that we are going to continue to go much higher.
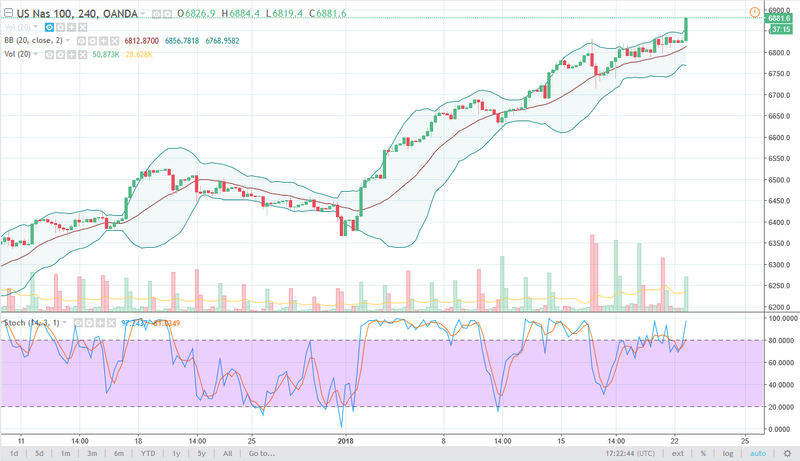
NASDAQ 100
On Friday, I suggested that perhaps the NASDAQ 100 could suddenly start leading the way in the United States, and that appears to be what’s happened on Monday. Short-term pullback should be buying opportunities, and I think that the 6800-level underneath should continue to offer a bit of a short-term floor. I believe that the market is hell-bent on going to the 7000 handle, so every time it pulls back, I suspect that people who have missed the rally will be willing to throw money at it. I have no interest in shorting this market, the US stock markets are far too strong these days.
Dow Jones 30 and NASDAQ Index Video 23.01.18
This article was originally posted on FX Empire
More From FXEMPIRE:
AUD/USD and NZD/USD Fundamental Daily Forecast – Worries Over U.S. Tariffs Drive Aussie, Kiwi Lower
EUR/USD, AUD/USD, GBP/USD and USD/JPY Daily Outlook – January 23, 2018
He Did It Again – Vitalik Buterin Introduces DAICO, A new Fundraising Model. So what is DAICO?
BTG/USD DASH USD and XMR USD Price Forecast January 23, 2018, Technical Analysis
Oil Price Fundamental Daily Forecast – Market Saturated With Long Speculators
