
 Yahoo Finance
 EBOS Group Limited's (NZSE:EBO) Recent Stock Performance Looks Decent- Can Strong Fundamentals Be the Reason?
Most readers would already know that EBOS Group's (NZSE:EBO) stock increased by 4.3% over the past week. Given that the market rewards strong financials in the long-term, we wonder if that is the case in this instance. Particularly, we will be paying attention to EBOS Group's ROE today.
Return on Equity or ROE is a test of how effectively a company is growing its value and managing investors’ money. Put another way, it reveals the company's success at turning shareholder investments into profits.
Check out our latest analysis for EBOS Group
How Is ROE Calculated?
The formula for ROE is:
Return on Equity = Net Profit (from continuing operations) ÷ Shareholders' Equity
So, based on the above formula, the ROE for EBOS Group is:
11% = AU$263m ÷ AU$2.3b (Based on the trailing twelve months to December 2023).
The 'return' is the income the business earned over the last year. One way to conceptualize this is that for each NZ$1 of shareholders' capital it has, the company made NZ$0.11 in profit.
What Has ROE Got To Do With Earnings Growth?
So far, we've learned that ROE is a measure of a company's profitability. Depending on how much of these profits the company reinvests or "retains", and how effectively it does so, we are then able to assess a company’s earnings growth potential. Generally speaking, other things being equal, firms with a high return on equity and profit retention, have a higher growth rate than firms that don’t share these attributes.
EBOS Group's Earnings Growth And 11% ROE
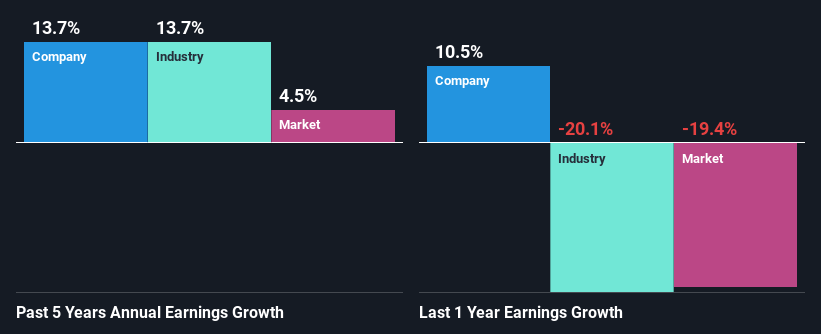
To begin with, EBOS Group seems to have a respectable ROE. Especially when compared to the industry average of 5.7% the company's ROE looks pretty impressive. This probably laid the ground for EBOS Group's moderate 14% net income growth seen over the past five years.
As a next step, we compared EBOS Group's net income growth with the industry and found that the company has a similar growth figure when compared with the industry average growth rate of 14% in the same period.
The basis for attaching value to a company is, to a great extent, tied to its earnings growth. It’s important for an investor to know whether the market has priced in the company's expected earnings growth (or decline). By doing so, they will have an idea if the stock is headed into clear blue waters or if swampy waters await. Is EBO fairly valued? This infographic on the company's intrinsic value has everything you need to know.
Is EBOS Group Using Its Retained Earnings Effectively?
The high three-year median payout ratio of 75% (or a retention ratio of 25%) for EBOS Group suggests that the company's growth wasn't really hampered despite it returning most of its income to its shareholders.
Moreover, EBOS Group is determined to keep sharing its profits with shareholders which we infer from its long history of paying a dividend for at least ten years. Based on the latest analysts' estimates, we found that the company's future payout ratio over the next three years is expected to hold steady at 71%. As a result, EBOS Group's ROE is not expected to change by much either, which we inferred from the analyst estimate of 13% for future ROE.
Conclusion
On the whole, we feel that EBOS Group's performance has been quite good. Especially the high ROE, Which has contributed to the impressive growth seen in earnings. Despite the company reinvesting only a small portion of its profits, it still has managed to grow its earnings so that is appreciable. With that said, the latest industry analyst forecasts reveal that the company's earnings growth is expected to slow down. Are these analysts expectations based on the broad expectations for the industry, or on the company's fundamentals? Click here to be taken to our analyst's forecasts page for the company.
Have feedback on this article? Concerned about the content? Get in touch with us directly. Alternatively, email editorial-team (at) simplywallst.com.
This article by Simply Wall St is general in nature. We provide commentary based on historical data and analyst forecasts only using an unbiased methodology and our articles are not intended to be financial advice. It does not constitute a recommendation to buy or sell any stock, and does not take account of your objectives, or your financial situation. We aim to bring you long-term focused analysis driven by fundamental data. Note that our analysis may not factor in the latest price-sensitive company announcements or qualitative material. Simply Wall St has no position in any stocks mentioned.
