
 Yahoo Finance
 Fletcher King Plc's (LON:FLK) Stock Is Rallying But Financials Look Ambiguous: Will The Momentum Continue?
Most readers would already be aware that Fletcher King's (LON:FLK) stock increased significantly by 11% over the past month. However, we decided to pay attention to the company's fundamentals which don't appear to give a clear sign about the company's financial health. Specifically, we decided to study Fletcher King's ROE in this article.
ROE or return on equity is a useful tool to assess how effectively a company can generate returns on the investment it received from its shareholders. In other words, it is a profitability ratio which measures the rate of return on the capital provided by the company's shareholders.
Check out our latest analysis for Fletcher King
How To Calculate Return On Equity?
The formula for ROE is:
Return on Equity = Net Profit (from continuing operations) ÷ Shareholders' Equity
So, based on the above formula, the ROE for Fletcher King is:
5.6% = UK£233k ÷ UK£4.2m (Based on the trailing twelve months to April 2023).
The 'return' is the yearly profit. Another way to think of that is that for every £1 worth of equity, the company was able to earn £0.06 in profit.
What Is The Relationship Between ROE And Earnings Growth?
We have already established that ROE serves as an efficient profit-generating gauge for a company's future earnings. We now need to evaluate how much profit the company reinvests or "retains" for future growth which then gives us an idea about the growth potential of the company. Assuming everything else remains unchanged, the higher the ROE and profit retention, the higher the growth rate of a company compared to companies that don't necessarily bear these characteristics.
Fletcher King's Earnings Growth And 5.6% ROE
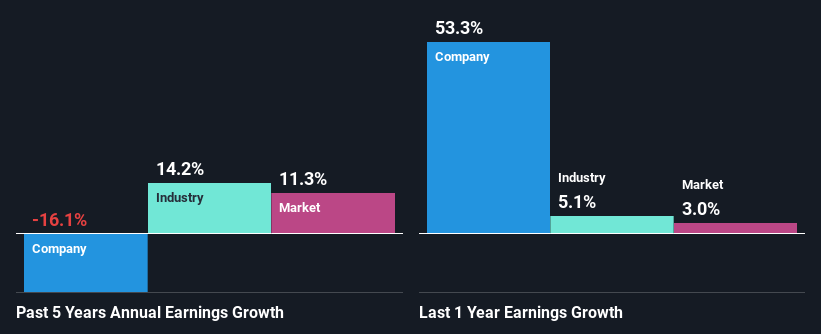
When you first look at it, Fletcher King's ROE doesn't look that attractive. Next, when compared to the average industry ROE of 7.5%, the company's ROE leaves us feeling even less enthusiastic. Therefore, it might not be wrong to say that the five year net income decline of 16% seen by Fletcher King was probably the result of it having a lower ROE. We reckon that there could also be other factors at play here. For example, it is possible that the business has allocated capital poorly or that the company has a very high payout ratio.
However, when we compared Fletcher King's growth with the industry we found that while the company's earnings have been shrinking, the industry has seen an earnings growth of 14% in the same period. This is quite worrisome.
The basis for attaching value to a company is, to a great extent, tied to its earnings growth. It’s important for an investor to know whether the market has priced in the company's expected earnings growth (or decline). This then helps them determine if the stock is placed for a bright or bleak future. One good indicator of expected earnings growth is the P/E ratio which determines the price the market is willing to pay for a stock based on its earnings prospects. So, you may want to check if Fletcher King is trading on a high P/E or a low P/E, relative to its industry.
Is Fletcher King Making Efficient Use Of Its Profits?
Looking at its three-year median payout ratio of 30% (or a retention ratio of 70%) which is pretty normal, Fletcher King's declining earnings is rather baffling as one would expect to see a fair bit of growth when a company is retaining a good portion of its profits. It looks like there might be some other reasons to explain the lack in that respect. For example, the business could be in decline.
Moreover, Fletcher King has been paying dividends for at least ten years or more suggesting that management must have perceived that the shareholders prefer dividends over earnings growth.
Summary
On the whole, we feel that the performance shown by Fletcher King can be open to many interpretations. While the company does have a high rate of profit retention, its low rate of return is probably hampering its earnings growth. Wrapping up, we would proceed with caution with this company and one way of doing that would be to look at the risk profile of the business. To know the 4 risks we have identified for Fletcher King visit our risks dashboard for free.
Have feedback on this article? Concerned about the content? Get in touch with us directly. Alternatively, email editorial-team (at) simplywallst.com.
This article by Simply Wall St is general in nature. We provide commentary based on historical data and analyst forecasts only using an unbiased methodology and our articles are not intended to be financial advice. It does not constitute a recommendation to buy or sell any stock, and does not take account of your objectives, or your financial situation. We aim to bring you long-term focused analysis driven by fundamental data. Note that our analysis may not factor in the latest price-sensitive company announcements or qualitative material. Simply Wall St has no position in any stocks mentioned.
