
 Yahoo Finance
 GAMCO Investors, Inc. Reports Results for the Fourth Quarter and Year Ended December 31, 2023

GUSTO half page ad
Quarter End AUM of $31.1 billion; Average AUM of $29.5 billion for the Fourth Quarter
Operating Margin of 27.6% for the Fourth Quarter and 28.1% for full year 2023
Fourth Quarter Fully Diluted EPS of $0.66 versus $0.52 for Third Quarter 2023 and $0.83 in the Fourth Quarter of 2022
2023 Fully Diluted EPS of $2.38 versus $2.51 for 2022
Ended 2023 with $166.0 million in cash and cash equivalents
GREENWICH, Conn., Feb. 06, 2024 (GLOBE NEWSWIRE) -- GAMCO Investors, Inc. (“GAMI”) (OTCQX: GAMI) today reported its operating results for the quarter ended December 31, 2023.
Financial Highlights
(In thousands, except percentages and per share data) |
|
|
|
|
|
|
| ||||||||||||
|
| Three Months Ended |
| % Change From |
| ||||||||||||||
|
| December 31, |
| September 30, |
| December 31, |
| September 30, |
| December 31, |
| ||||||||
U.S. GAAP |
|
|
|
|
|
|
|
|
|
|
| ||||||||
Revenue |
| $ | 57,313 |
|
| $ | 59,475 |
|
| $ | 61,602 |
|
| -3.6 | % |
| -7.0 | % |
|
Expenses |
|
| 41,517 |
|
|
| 41,954 |
|
|
| 44,595 |
|
| -1.0 | % |
| -6.9 | % |
|
Operating income |
|
| 15,796 |
|
|
| 17,521 |
|
|
| 17,007 |
|
| -9.8 | % |
| -7.1 | % |
|
Non-operating income (loss) |
| 6,199 |
|
|
| 303 |
|
|
| 3,553 |
|
| 1945.9 | % |
| 74.5 | % |
| |
Net income |
|
| 16,560 |
|
|
| 13,137 |
|
|
| 21,396 |
|
| 26.1 | % |
| -22.6 | % |
|
Diluted earnings per share |
| $ | 0.66 |
|
| $ | 0.52 |
|
| $ | 0.83 |
|
| 26.9 | % |
| -20.5 | % |
|
Operating margin |
|
| 27.6 | % |
|
| 29.5 | % |
|
| 27.6 | % |
| (190) bps |
|
| 0 bps |
|
|
|
|
|
|
|
|
|
|
|
|
|
| ||||||||
Giving Back to Society - $74 million since IPO
Since our initial public offering in February 1999, our firm’s combined charitable donations total approximately $74 million, including $48 million through the shareholder designated charitable contribution (“SDCC”) program. Based on the program created by Warren Buffett at Berkshire Hathaway, our corporate charitable giving is unique in that the recipients of GAMI’s charitable contributions are chosen directly by our shareholders, rather than by our corporate officers. Since its inception in 2013, GAMI shareholders have designated charitable gifts to approximately 350 charitable organizations.
Revenue
(In thousands) |
| Three Months Ended |
|
|
|
|
| |||||||
|
| December 31, |
| December 31, |
| $ Change |
| % Change |
| |||||
Investment advisory and incentive fees |
|
|
|
|
|
|
|
|
| |||||
Fund revenues |
| $ | 37,748 |
| $ | 37,369 |
| $ | 379 |
|
| 1.0 | % |
|
Institutional and Private Wealth Management |
|
| 13,712 |
|
| 13,826 |
|
| (114 | ) |
| -0.8 | % |
|
SICAV |
|
| 1,541 |
|
| 5,436 |
|
| (3,895 | ) |
| -71.7 | % |
|
Total |
| $ | 53,001 |
| $ | 56,631 |
| $ | (3,630 | ) |
| -6.4 | % |
|
Distribution fees and other income |
|
| 4,312 |
|
| 4,971 |
|
| (659 | ) |
| -13.3 | % |
|
Total revenue |
| $ | 57,313 |
| $ | 61,602 |
| $ | (4,289 | ) |
| -7.0 | % |
|
|
|
|
|
|
|
|
|
|
| |||||
Incentive fees earned during the fourth quarter of 2023 was $1.9 million versus $3.3 million during the fourth quarter of 2022. The remainder of the year over year decline reflects a modest drop in average equity AUM at December 31, 2023 from December 31, 2022.
Expenses
(In thousands) |
| Three Months Ended |
|
|
|
|
| |||||||
|
| December 31, |
| December 31, |
| $ Change |
| % Change |
| |||||
Compensation |
| $ | 27,316 |
| $ | 28,420 |
| $ | (1,104 | ) |
| -3.9 | % |
|
Management fee |
|
| 2,444 |
|
| 2,283 |
|
| 161 |
|
| 7.1 | % |
|
Distribution costs |
|
| 5,848 |
|
| 5,460 |
|
| 388 |
|
| 7.1 | % |
|
Other operating expenses |
|
| 5,909 |
|
| 8,432 |
|
| (2,523 | ) |
| -29.9 | % |
|
Total expenses |
| $ | 41,517 |
| $ | 44,595 |
| $ | (3,078 | ) |
| -6.9 | % |
|
|
|
|
|
|
|
|
|
|
| |||||
The lower compensation expense in the fourth quarter reflected lower variable compensation ($0.8 million), lower fixed compensation ($0.2 million), and lower stock-based compensation ($0.1 million).
Higher pre-management fee income of $1.6 million resulted in a $0.2 million increase in management fee.
Distribution costs were higher based on slightly higher expense reimbursements in open-end funds; and,
The lower other operating expenses this quarter versus the fourth quarter of 2022 are due to the absence of subadvisory performance fees for the merger arbitrage SICAV in 2023.
Operating Margin
The operating margin, which represents the ratio of operating income to revenue, was 27.6% for the fourth quarter of 2023 compared with 29.5% for the third quarter of 2023.
Non-Operating Income
(In thousands) |
| Three Months Ended |
|
|
|
|
| |||||||||
|
| December 31, |
| December 31, |
| $ Change |
| % Change |
| |||||||
Gain / (loss) from investments, net |
| $ | 3,529 |
|
| $ | (3,354 | ) |
| $ | 6,883 |
|
| -205.2 | % |
|
Interest and dividend income |
|
| 2,951 |
|
|
| 7,198 |
|
|
| (4,247 | ) |
| -59.0 | % |
|
Interest expense |
|
| (281 | ) |
|
| (291 | ) |
|
| 10 |
|
| -3.4 | % |
|
Total non-operating income / (loss) |
| $ | 6,199 |
|
| $ | 3,553 |
|
| $ | 2,646 |
|
| 74.5 | % |
|
|
|
|
|
|
|
|
|
|
| |||||||
Non-operating income increased for the quarter, reflecting the higher mark to market values on our investment portfolio for the quarter and the higher earnings on our cash and cash equivalents balances.
Other financial highlights
The effective income tax rate for the fourth quarter of 2023 was 24.7% versus a credit for the fourth quarter of 2023.
Cash and cash equivalents were $166.0 million at December 31, 2023.
Assets Under Management
(In millions) |
| As of |
| % Change |
| |||||||||||
|
| December 31, |
| September 30, |
| December 31, |
| September 30, |
| December 31, |
| |||||
|
|
|
|
|
|
|
|
|
|
|
| |||||
Mutual Funds |
| $ | 7,973 |
| $ | 7,546 |
| $ | 8,140 |
| 5.7 | % |
| -2.1 | % |
|
Closed-end Funds |
|
| 7,097 |
|
| 6,727 |
|
| 7,046 |
| 5.5 | % |
| 0.7 | % |
|
Institutional & PWM (a) (b) |
|
| 10,738 |
|
| 10,034 |
|
| 10,714 |
| 7.0 | % |
| 0.2 | % |
|
SICAV (c) |
|
| 631 |
|
| 622 |
|
| 867 |
| 1.4 | % |
| -27.2 | % |
|
Total Equities |
|
| 26,439 |
|
| 24,929 |
|
| 26,767 |
| 6.1 | % |
| -1.2 | % |
|
|
|
|
|
|
|
|
|
|
|
|
| |||||
100% U.S. Treasury Money Market Fund |
|
| 4,615 |
|
| 4,217 |
|
| 2,462 |
| 9.4 | % |
| 87.4 | % |
|
Institutional & PWM Fixed Income |
|
| 32 |
|
| 32 |
|
| 32 |
| 0.0 | % |
| 0.0 | % |
|
Total Treasuries & Fixed Income |
|
| 4,647 |
|
| 4,249 |
|
| 2,494 |
| 9.4 | % |
| 86.3 | % |
|
Total Assets Under Management |
| $ | 31,086 |
| $ | 29,178 |
| $ | 29,261 |
| 6.5 | % |
| 6.2 | % |
|
|
|
|
|
|
|
|
|
|
|
|
| |||||
(a) Includes $370, $401, and $467 of AUM subadvised for Teton Advisors, Inc. at December 31, 2023, September 30, 2023, and December 31, 2022, respectively. |
| |||||||||||||||
(b) Includes $227, $230, and $223 of 100% U.S. Treasury Money Market Fund AUM at December 31, 2023, September 30, 2023, and December 31, 2022, respectively. |
| |||||||||||||||
(c) Includes $620, $613, and $856 of the SICAV AUM subadvised by Associated Capital Group, Inc. at December 31, 2023, September 30, 2023, and December 31, 2022, respectively. |
|
|
| |||||||||||||
|
|
|
|
|
|
|
|
|
|
|
| |||||
Assets under management on December 31, 2023 were $31.1 billion, an increase of 6.5% from the $29.2 billion on September 30, 2023 reflecting general market trends. The quarter’s increase consisted of market appreciation of $2.4 billion, net outflows of $345 million and distributions, net of reinvestments, of $146 million.
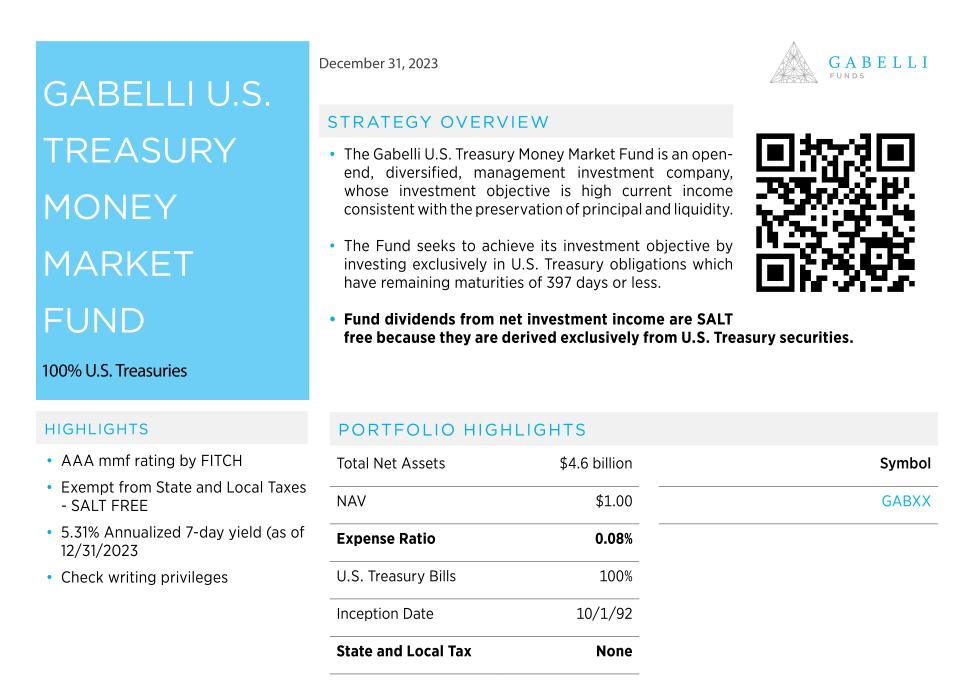
100% U.S. Treasury Money Market Fund
Assets under management in our 100% U.S. Treasury Money Market Fund (GABXX) on December 31, 2023 were $4.6 billion, up from $2.5 billion at December 31, 2022.
A photo accompanying this announcement is available at https://www.globenewswire.com/NewsRoom/AttachmentNg/37834f82-c694-4d5d-b235-a8d50ee6f543
The Gabelli Growth Fund – Up 45.4% For 2023
Howard Ward, CFA, the CIO of Growth Investing, commented on The Gabelli Growth Fund’s 2023 performance: “The stars aligned for growth stocks in 2023. Valuations were depressed after a tough 2022 courtesy of rapidly rising interest rates. Earnings got a boost as many companies that had over invested during the pandemic cut costs, both labor and capital spending. Technology spending, which has been in a secular upturn, accelerated on the excitement generated by artificial intelligence breakthroughs and demand for leading edge cybersecurity solutions. Additionally, e-commerce continued to gain share over bricks and mortar and electric vehicles gained share on gasoline-powered vehicles. As inflation cooled and prospects for lower interest rates improved, growth stocks, especially technology driven growth stocks, led the stock market higher. We owned and continue to own positions in the so-called Magnificent 7-stocks (Mag 7), consisting of Nvidia, Microsoft, Apple, Amazon, Alphabet, Meta Platforms, and Tesla. Over half of the fund’s assets are invested in technology centric companies. The fund’s annual return of 45.4% was helped by the Mag 7 and other technology holdings such as ServiceNow and CrowdStrike. Other outsized gainers included Eli Lilly (boosted by the success of Mounjaro and Zepbound for type 2 diabetes and weight loss, respectively) and Chipotle Mexican Grill.”
The Gabelli Small Cap Growth Fund
We utilize our own in-house team of over 40 industry equity analysts and portfolio managers to pick the stocks in the fund, using our bottom-up research-intensive process and, more importantly, our accumulated and compounded knowledge of selected industry sectors. We use GAPIC – gather, array, project, interpret, and communicate data daily. We have consistently applied our Private Market Value with a Catalyst approach to help generate our superior returns.
ETFs
The firm launched its first active ETF, the Gabelli Love Our Planet & People ETF (NYSE: LOPP) in January 2021 to extend the tax benefits of owning exchange traded funds to our investors. Since the initial launch, the Gabelli platform has steadily grown the differentiated suite of ETFs. In 2023, Gabelli Growth Innovators (NYSE: GGRW), managed by Howard Ward, generated a 42.2% total return, while the Gabelli Financial Services Opportunities ETF (NYSE: GABF), led by Macrae Sykes, produced a 38.9% total return. We are pleased with the client adoption progress and excited about this growth area of the market and positioning of these unique funds supported by our investment team. To accelerate the growth of these funds, each of the funds (with the exception of GGRW) have fee and expense waivers for at least the first $25 million of assets, where LOPP has a fee and expense waiver for the first $100 million of assets under management.
Mutual Funds
Assets under management in Mutual Funds on December 31, 2023 were $8.0 billion, an increase of 5.7% from the $7.5 billion at September 30, 2023. The quarterly change was attributed to:
Distributions, net of reinvestment, of $19 million;
Market appreciation of $744 million; and
Net outflows of $298 million.
Closed-end Funds
Assets under management in Closed-end Funds on December 31, 2023 were $7.1 billion, an increase of 5.5% from the $6.7 billion on September 30, 2023. The quarterly change was comprised of:
Distributions, net of reinvestment, of $127 million;
Market appreciation of $544 million; and
Net outflows consisting of the issuance of $16 million preferred, the redemption of $43 million of preferred shares, and $20 million of common stock repurchased by the Funds.
Institutional & PWM
Assets under management in Institutional & PWM on December 31, 2023 were $10.7 billion, an increase of 7.0% from the $10.0 billion on September 30, 2023. The quarterly change was due to:
Net outflows of $308 million; and
Market appreciation of $1.0 billion.
SICAV
Assets under management in SICAV on December 31, 2023 were $631 million, an increase from the $622 million on September 30, 2023. The quarterly change was comprised as follows:
Net outflows of $28 million; and
Market appreciation of $37 million.
Balance Sheet Information
As of December 31, 2023, cash and cash equivalents were $166.0 million and investments were $38.9 million, compared with cash and cash equivalents of $79.7 million and investments of $89.8 million as of December 31, 2022. As of December 31, 2023, stockholders’ equity was $181.0 million compared to $139.1 million as of December 31, 2022.
Return to Shareholders
During the fourth quarter, GAMI paid a dividend of $0.04 per share for a total of $1.0 million and purchased 246,820 shares for $4.7 million at an average investment of $18.96 per share. On November 7, 2023, the Board of Directors increased the buyback authorization by 500,000 shares. From January 1, 2024 to February 6, 2024, the Company has purchased 48,200 shares at an average investment of $18.65 per share.
On February 6, 2024, GAMI’s board of directors declared a regular quarterly dividend of $0.04 per share, which is payable on March 26, 2024, to class A and class B shareholders of record on March 12, 2024.
Symposiums
On October 30th and 31st, we hosted our 47th Annual Automotive Symposium in Las Vegas. The symposium featured presentations from senior management of leading automotive and electric vehicle suppliers.
On November 17th, we hosted our Fifth Annual Healthcare Symposium in conjunction with Columbia Business School.
About GAMCO Investors, Inc.
GAMI is best known for its research-driven value approach to equity investing (known as PMV with a CatalystTM). GAMI conducts its investment advisory business principally through two subsidiaries: Gabelli Funds, LLC (24 open-end funds, 14 closed-end funds, 5 actively managed semi-transparent ETFs, and a SICAV) and GAMCO Asset Management Inc. (approximately 1,400 institutional and private wealth separate accounts). GAMI serves a broad client base including institutions, intermediaries, private wealth, and direct retail investors. In recent years, GAMI has successfully integrated new teams of RIAs by providing attractive compensation arrangements and extensive research capabilities.
Gabelli Funds offers a wide range of solutions for clients across Value and Growth Equity, SRI, Convertibles, sector-focused strategies including Gold and Utilities, Merger Arbitrage, and U.S. Treasury Money Market Fixed Income.
CAUTIONARY STATEMENT REGARDING FORWARD-LOOKING STATEMENTS
Our disclosure and analysis in this press release, which do not present historical information, contain “forward-looking statements” within the meaning of the U.S. Private Securities Litigation Reform Act of 1995. Forward-looking statements convey our current expectations or forecasts of future events. You can identify these statements because they do not relate strictly to historical or current facts. They use words such as “anticipate,” “estimate,” “expect,” “project,” “intend,” “plan,” “believe,” and other words and terms of similar meaning. They also appear in any discussion of future operating or financial performance. In particular, these include statements relating to future actions, future performance of our products, expenses, the outcome of any legal proceedings, and financial results. Although we believe that we are basing our expectations and beliefs on reasonable assumptions within the bounds of what we currently know about our business and operations, the economy, and other conditions, there can be no assurance that our actual results will not differ materially from what we expect or believe. Therefore, you should proceed with caution in relying on any of these forward-looking statements. They are neither statements of historical fact nor guarantees or assurances of future performance.
Forward-looking statements involve a number of known and unknown risks, uncertainties and other important factors, some of which are listed below, that are difficult to predict and could cause actual results and outcomes to differ materially from any future results or outcomes expressed or implied by such forward-looking statements. Some of the factors that may cause our actual results to differ from our expectations include risks associated with the duration and scope of the ongoing coronavirus pandemic resulting in volatile market conditions, a decline in the securities markets that adversely affect our assets under management, negative performance of our products, the failure to perform as required under our investment management agreements, and a general downturn in the economy that negatively impacts our operations. We also direct your attention to the more specific discussions of these and other risks, uncertainties and other important factors contained in our Annual Report and other public filings. Other factors that could cause our actual results to differ may emerge from time to time, and it is not possible for us to predict all of them. We do not undertake to update publicly any forward-looking statements if we subsequently learn that we are unlikely to achieve our expectations whether as a result of new information, future developments or otherwise, except as may be required by law.
Gabelli Funds, LLC is a registered investment adviser with the Securities and Exchange Commission and is a wholly owned subsidiary of GAMCO Investors, Inc. (OTCQX: GAMI).
Investors should carefully consider the investment objectives, risks, charges and expenses of the Fund before investing. The prospectus, which contains more complete information about this and other matters, should be read carefully before investing. To obtain a prospectus, please call 800 GABELLI or visit www.gabelli.com
The Gabelli active ETFs are different from traditional ETFs. Traditional ETFs tell the public what assets they hold each day. These ETFs will not. This may create additional risks for your investment. For example:
You may have to pay more money to trade the ETFs shares. These ETFs will provide less information to traders, who tend to charge more for trades when they have less information.
The price you pay to buy ETF shares on an exchange may not match the value of the ETF’s portfolio. The same is true when you sell shares. These price differences may be greater for these ETFs compared to other ETFs because it provides less information to traders.
These additional risks may be even greater in bad or uncertain market conditions. The differences between these ETFs and other ETFs may also have advantages. By keeping certain information about these ETFs secret, these ETFs may face less risk that other traders can predict or copy its investment strategy. This may improve these ETFs’ performance. If other traders are able to copy or predict these ETFs’ investment strategies, however, this may hurt these ETFs’ performance. For additional information regarding the unique attributes and risks of these ETFs, see the ActiveShares prospectus/registration statement.
Financial services companies operate in heavily regulated industries, which are subject to change. The underlying securities are subject to credit and interest rate sensitivity risk, which could affect earnings. Additionally, since financial services firms are correlated to GDP, a decline in the economic environment could impact profitability.
GABF
Financial services companies operate in heavily regulated industries, which are subject to change. The underlying securities are subject to credit and interest rate sensitivity risk, which could impact earnings. Additionally, since financial services firms are correlated to GDP, a decline in the economic environment could impact profitability.
GGRW
Securities of growth companies may be more volatile since such companies usually invest a high portion of earnings in their business, and they may lack the dividends of value stocks that can cushion stock prices in a falling market.
Money Market Fund
Investment in the fund is neither guaranteed nor insured by the Federal Deposit Insurance Corporation or any government agency. Although the fund seeks to preserve the value of your investment at $1.00 per share, it cannot guarantee it will do so. The fund’s sponsor has no legal obligation to provide financial support to the fund, and you should not expect that the sponsor will provide financial support to the fund at any time. You could lose money by investing in the fund.
Small Cap
Small capitalization stocks are subject to significant price fluctuations and business risks. The stocks of smaller companies may trade less frequently and experience more abrupt price movements than stocks of larger companies; therefore, investing in this sector involves special challenges.
Growth
As of December 31, 2023, GAMI and affiliates owned less than one percent of all stocks mentioned in the Growth Fund.
Returns represent past performance and do not guarantee future results. Investment returns and the principal value of an investment will fluctuate. When shares are redeemed, they may be worth more or less than their original cost. Current performance may be lower or higher than the performance data presented. Visit www.gabelli.com for performance information as of the most recent month end.
GAMCO Investors, Inc. and Subsidiaries |
|
|
| ||||||||||||||||
Condensed Consolidated Statements of Operations (Unaudited) |
| ||||||||||||||||||
(in thousands, except per share data) |
|
|
| ||||||||||||||||
|
| Three Months Ended |
| % Change From |
| ||||||||||||||
|
| December 31, |
| September 30, |
| December 31, |
| September 30, |
| December 31, |
| ||||||||
Revenue: |
|
|
|
|
|
|
|
|
|
|
| ||||||||
Investment advisory and incentive fees |
| $ | 53,001 |
|
| $ | 54,767 |
|
| $ | 56,631 |
|
|
|
|
|
| ||
Distribution fees and other income |
|
| 4,312 |
|
|
| 4,708 |
|
|
| 4,971 |
|
|
|
|
|
| ||
Total revenue |
|
| 57,313 |
|
|
| 59,475 |
|
|
| 61,602 |
|
| -3.6 | % |
| -7.0 | % |
|
Expenses: |
|
|
|
|
|
|
|
|
|
|
| ||||||||
Compensation |
|
| 27,316 |
|
|
| 28,192 |
|
|
| 28,420 |
|
|
|
|
|
| ||
Management fee |
|
| 2,444 |
|
|
| 1,980 |
|
|
| 2,283 |
|
|
|
|
|
| ||
Distribution costs |
|
| 5,848 |
|
|
| 5,992 |
|
|
| 5,460 |
|
|
|
|
|
| ||
Other operating expenses |
|
| 5,909 |
|
|
| 5,790 |
|
|
| 8,432 |
|
|
|
|
|
| ||
Total expenses |
|
| 41,517 |
|
|
| 41,954 |
|
|
| 44,595 |
|
| -1.0 | % |
| -6.9 | % |
|
Operating income |
|
| 15,796 |
|
|
| 17,521 |
|
|
| 17,007 |
|
| -9.8 | % |
| -7.1 | % |
|
Non-operating income (loss): |
|
|
|
|
|
|
|
|
|
|
| ||||||||
Gain / (loss) from investments, net |
|
| 3,529 |
|
|
| (1,952 | ) |
|
| (3,354 | ) |
|
|
|
|
| ||
Interest and dividend income |
|
| 2,951 |
|
|
| 2,542 |
|
|
| 7,198 |
|
|
|
|
|
| ||
Interest expense |
|
| (281 | ) |
|
| (287 | ) |
|
| (291 | ) |
|
|
|
|
| ||
Total non-operating income / (loss) |
|
| 6,199 |
|
|
| 303 |
|
|
| 3,553 |
|
| 1945.9 | % |
| 74.5 | % |
|
Income before provision for income taxes |
|
| 21,995 |
|
|
| 17,824 |
|
|
| 20,560 |
|
| 23.4 | % |
| 7.0 | % |
|
Provision for income taxes |
|
| 5,435 |
|
|
| 4,687 |
|
|
| (836 | ) |
|
|
|
|
| ||
Net income |
| $ | 16,560 |
|
| $ | 13,137 |
|
| $ | 21,396 |
|
| 26.1 | % |
| -22.6 | % |
|
|
|
|
|
|
|
|
|
|
|
|
| ||||||||
Earnings per share attributable to common |
|
|
|
|
|
|
|
|
|
| |||||||||
stockholders: |
|
|
|
|
|
|
|
|
|
|
| ||||||||
Basic |
| $ | 0.66 |
|
| $ | 0.52 |
|
| $ | 0.83 |
|
| 26.9 | % |
| -20.5 | % |
|
Diluted |
| $ | 0.66 |
|
| $ | 0.52 |
|
| $ | 0.83 |
|
| 26.9 | % |
| -20.5 | % |
|
|
|
|
|
|
|
|
|
|
|
|
| ||||||||
Weighted average shares outstanding: |
|
|
|
|
|
|
|
|
|
|
| ||||||||
Basic |
|
| 25,038 |
|
|
| 25,224 |
|
|
| 25,648 |
|
|
|
|
|
| ||
Diluted |
|
| 25,038 |
|
|
| 25,224 |
|
|
| 25,665 |
|
|
|
|
|
| ||
|
|
|
|
|
|
|
|
|
|
|
| ||||||||
Shares outstanding |
|
| 24,906 |
|
|
| 25,153 |
|
|
| 25,680 |
|
|
|
|
|
| ||
|
|
|
|
|
|
|
|
|
|
|
| ||||||||
GAMCO Investors, Inc. and Subsidiaries |
|
|
|
|
| ||
Condensed Consolidated Statements of Financial Condition (Unaudited) |
|
| |||||
(in thousands) |
|
|
|
|
| ||
|
|
|
| ||||
|
| December 31, |
| December 31, |
| ||
|
| 2023 |
| 2022 |
| ||
Assets |
|
|
|
|
| ||
Cash, cash equivalents, and U.S. Treasury Bills |
| $ | 61,801 |
| $ | 66,381 |
|
Investments in securities |
|
| 119,023 |
|
| 84,742 |
|
Seed capital investments |
|
| 24,044 |
|
| 18,347 |
|
Receivable from brokers |
|
| 4,562 |
|
| 1,932 |
|
Other receivables |
|
| 21,178 |
|
| 25,839 |
|
Deferred tax asset and income tax receivable |
|
| 8,927 |
|
| 16,701 |
|
Other assets |
|
| 9,896 |
|
| 9,879 |
|
Total assets |
| $ | 249,431 |
| $ | 223,821 |
|
|
|
|
|
|
| ||
Liabilities and stockholders' equity |
|
|
|
|
| ||
Payable for investments purchased |
| $ | - |
| $ | 2,980 |
|
Income taxes payable |
|
| 17 |
|
| - |
|
Compensation payable |
|
| 23,399 |
|
| 33,919 |
|
Accrued expenses and other liabilities |
|
| 45,036 |
|
| 47,868 |
|
Total liabilities |
|
| 68,452 |
|
| 84,767 |
|
|
|
|
|
|
| ||
Stockholders' equity |
|
| 180,979 |
|
| 139,054 |
|
Total liabilities and stockholders' equity |
| $ | 249,431 |
| $ | 223,821 |
|
|
|
|
|
|
| ||
Shares outstanding |
|
| 24,906 |
|
| 25,680 |
|
|
|
|
|
|
| ||
GAMCO Investors, Inc. and Subsidiaries |
| |||||||||||||||||||
Assets Under Management |
|
|
|
|
|
|
| |||||||||||||
By investment vehicle |
|
|
|
|
|
|
|
|
|
|
| |||||||||
(in millions) |
|
|
|
|
|
|
|
|
|
|
| |||||||||
|
|
| Three Months Ended |
| % Changed From |
| ||||||||||||||
|
|
| December 31, |
| September 30, |
| December 31, |
| September 30, |
| December 31, |
| ||||||||
|
|
|
| 2023 |
|
|
| 2023 |
|
|
| 2022 |
|
| 2023 |
| 2022 |
| ||
Equities: |
|
|
|
|
|
|
|
|
|
|
| |||||||||
Mutual Funds |
|
|
|
|
|
|
|
|
|
|
| |||||||||
Beginning of period assets |
| $ | 7,546 |
|
| $ | 8,271 |
|
| $ | 7,689 |
|
|
|
|
|
| |||
| Inflows |
|
| 153 |
|
|
| 146 |
|
|
| 145 |
|
|
|
|
|
| ||
| Outflows |
|
| (451 | ) |
|
| (363 | ) |
|
| (436 | ) |
|
|
|
|
| ||
| Net inflows (outflows) |
|
| (298 | ) |
|
| (217 | ) |
|
| (291 | ) |
|
|
|
|
| ||
| Market appreciation (depreciation) |
|
| 744 |
|
|
| (503 | ) |
|
| 770 |
|
|
|
|
|
| ||
| Fund distributions, net of reinvestment |
|
| (19 | ) |
|
| (5 | ) |
|
| (28 | ) |
|
|
|
|
| ||
| Total increase (decrease) |
|
| 427 |
|
|
| (725 | ) |
|
| 451 |
|
|
|
|
|
| ||
Assets under management, end of period |
| $ | 7,973 |
|
| $ | 7,546 |
|
| $ | 8,140 |
|
| 5.7 | % |
| -2.1 | % |
| |
Percentage of total assets under management |
|
| 25.6 | % |
|
| 25.9 | % |
|
| 27.8 | % |
|
|
|
|
| |||
Average assets under management |
| $ | 7,593 |
|
| $ | 8,100 |
|
| $ | 8,159 |
|
| -6.3 | % |
| -6.9 | % |
| |
|
|
|
|
|
|
|
|
|
|
|
|
| ||||||||
Closed-end Funds |
|
|
|
|
|
|
|
|
|
|
| |||||||||
Beginning of period assets |
| $ | 6,727 |
|
| $ | 7,195 |
|
| $ | 6,580 |
|
|
|
|
|
| |||
| Inflows |
|
| 16 |
|
|
| - |
|
|
| 15 |
|
|
|
|
|
| ||
| Outflows |
|
| (63 | ) |
|
| (29 | ) |
|
| (101 | ) |
|
|
|
|
| ||
| Net inflows (outflows) |
|
| (47 | ) |
|
| (29 | ) |
|
| (86 | ) |
|
|
|
|
| ||
| Market appreciation (depreciation) |
|
| 544 |
|
|
| (312 | ) |
|
| 676 |
|
|
|
|
|
| ||
| Fund distributions, net of reinvestment |
|
| (127 | ) |
|
| (127 | ) |
|
| (124 | ) |
|
|
|
|
| ||
| Total increase (decrease) |
|
| 370 |
|
|
| (468 | ) |
|
| 466 |
|
|
|
|
|
| ||
Assets under management, end of period |
|
| 7,097 |
|
| $ | 6,727 |
|
| $ | 7,046 |
|
| 5.5 | % |
| 0.7 | % |
| |
Percentage of total assets under management |
|
| 22.8 | % |
|
| 23.1 | % |
|
| 24.1 | % |
|
|
|
|
| |||
Average assets under management |
| $ | 6,785 |
|
| $ | 7,124 |
|
| $ | 7,031 |
|
| -4.8 | % |
| -3.5 | % |
| |
|
|
|
|
|
|
|
|
|
|
|
|
| ||||||||
Institutional & PWM |
|
|
|
|
|
|
|
|
|
|
| |||||||||
Beginning of period assets |
| $ | 10,034 |
|
| $ | 11,035 |
|
| $ | 9,832 |
|
|
|
|
|
| |||
| Inflows |
|
| 63 |
|
|
| 51 |
|
|
| 106 |
|
|
|
|
|
| ||
| Outflows |
|
| (371 | ) |
|
| (513 | ) |
|
| (458 | ) |
|
|
|
|
| ||
| Net inflows (outflows) |
|
| (308 | ) |
|
| (462 | ) |
|
| (352 | ) |
|
|
|
|
| ||
| Market appreciation (depreciation) |
|
| 1,012 |
|
|
| (539 | ) |
|
| 1,234 |
|
|
|
|
|
| ||
| Total increase (decrease) |
|
| 704 |
|
|
| (1,001 | ) |
|
| 882 |
|
|
|
|
|
| ||
Assets under management, end of period |
| $ | 10,738 |
|
| $ | 10,034 |
|
| $ | 10,714 |
|
| 7.0 | % |
| 0.2 | % |
| |
Percentage of total assets under management |
|
| 34.5 | % |
|
| 34.4 | % |
|
| 36.6 | % |
|
|
|
|
| |||
Average assets under management |
| $ | 10,005 |
|
| $ | 10,928 |
|
| $ | 10,884 |
|
| -8.4 | % |
| -8.1 | % |
| |
|
|
|
|
|
|
|
|
|
|
|
|
| ||||||||
SICAV |
|
|
|
|
|
|
|
|
|
|
| |||||||||
Beginning of period assets |
| $ | 622 |
|
| $ | 590 |
|
| $ | 785 |
|
|
|
|
|
| |||
| Inflows |
|
| 82 |
|
|
| 103 |
|
|
| 94 |
|
|
|
|
|
| ||
| Outflows |
|
| (110 | ) |
|
| (68 | ) |
|
| (90 | ) |
|
|
|
|
| ||
| Net inflows (outflows) |
|
| (28 | ) |
|
| 35 |
|
|
| 4 |
|
|
|
|
|
| ||
| Market appreciation (depreciation) |
|
| 37 |
|
|
| (3 | ) |
|
| 78 |
|
|
|
|
|
| ||
| Total increase (decrease) |
|
| 9 |
|
|
| 32 |
|
|
| 82 |
|
|
|
|
|
| ||
Assets under management, end of period |
| $ | 631 |
|
| $ | 622 |
|
| $ | 867 |
|
| 1.4 | % |
| -27.2 | % |
| |
Percentage of total assets under management |
|
| 2.0 | % |
|
| 2.1 | % |
|
| 3.0 | % |
|
|
|
|
| |||
Average assets under management |
| $ | 628 |
|
| $ | 610 |
|
| $ | 835 |
|
| 3.0 | % |
| -24.8 | % |
| |
|
|
|
|
|
|
|
|
|
|
|
|
| ||||||||
Total Equities |
|
|
|
|
|
|
|
|
|
|
| |||||||||
Beginning of period assets |
| $ | 24,929 |
|
| $ | 27,091 |
|
| $ | 24,886 |
|
|
|
|
|
| |||
| Inflows |
|
| 314 |
|
|
| 300 |
|
|
| 360 |
|
|
|
|
|
| ||
| Outflows |
|
| (995 | ) |
|
| (973 | ) |
|
| (1,085 | ) |
|
|
|
|
| ||
| Net inflows (outflows) |
|
| (681 | ) |
|
| (673 | ) |
|
| (725 | ) |
|
|
|
|
| ||
| Market appreciation (depreciation) |
|
| 2,337 |
|
|
| (1,357 | ) |
|
| 2,758 |
|
|
|
|
|
| ||
| Fund distributions, net of reinvestment |
|
| (146 | ) |
|
| (132 | ) |
|
| (152 | ) |
|
|
|
|
| ||
| Total increase (decrease) |
|
| 1,510 |
|
|
| (2,162 | ) |
|
| 1,881 |
|
|
|
|
|
| ||
Assets under management, end of period |
| $ | 26,439 |
|
| $ | 24,929 |
|
| $ | 26,767 |
|
| 6.1 | % |
| -1.2 | % |
| |
Percentage of total assets under management |
|
| 85.1 | % |
|
| 85.4 | % |
|
| 91.5 | % |
|
|
|
|
| |||
Average assets under management |
| $ | 25,011 |
|
| $ | 26,762 |
|
| $ | 26,909 |
|
| -6.5 | % |
| -7.1 | % |
| |
|
|
|
|
|
|
|
|
|
|
|
|
| ||||||||
|
|
|
|
|
|
|
|
|
|
|
|
| ||||||||
GAMCO Investors, Inc. and Subsidiaries |
|
|
| |||||||||||||||||
Assets Under Management |
|
|
|
|
| |||||||||||||||
By investment vehicle - continued |
|
|
|
|
|
| ||||||||||||||
(in millions) |
|
|
|
|
|
|
|
|
|
|
| |||||||||
|
|
| Three Months Ended |
| % Changed From |
| ||||||||||||||
|
|
| December 31, |
| September 30, |
| December 31, |
| September 30, |
| December 31, |
| ||||||||
|
|
|
| 2023 |
|
|
| 2023 |
|
|
| 2022 |
|
| 2023 |
| 2022 |
| ||
Fixed Income: |
|
|
|
|
|
|
|
|
|
|
| |||||||||
100% U.S. Treasury fund |
|
|
|
|
|
|
|
|
|
|
| |||||||||
Beginning of period assets |
| $ | 4,217 |
|
| $ | 3,596 |
|
| $ | 2,715 |
|
|
|
|
|
| |||
| Inflows |
|
| 1,424 |
|
|
| 1,297 |
|
|
| 1,340 |
|
|
|
|
|
| ||
| Outflows |
|
| (1,088 | ) |
|
| (728 | ) |
|
| (1,615 | ) |
|
|
|
|
| ||
| Net inflows (outflows) |
|
| 336 |
|
|
| 569 |
|
|
| (275 | ) |
|
|
|
|
| ||
| Market appreciation (depreciation) |
|
| 62 |
|
|
| 52 |
|
|
| 22 |
|
|
|
|
|
| ||
| Total increase (decrease) |
|
| 398 |
|
|
| 621 |
|
|
| (253 | ) |
|
|
|
|
| ||
Assets under management, end of period |
| $ | 4,615 |
|
| $ | 4,217 |
|
| $ | 2,462 |
|
| 9.4 | % |
| 87.4 | % |
| |
Percentage of total assets under management |
|
| 14.8 | % |
|
| 14.5 | % |
|
| 8.4 | % |
|
|
|
|
| |||
Average assets under management |
| $ | 4,418 |
|
| $ | 3,995 |
|
| $ | 2,554 |
|
| 10.6 | % |
| 73.0 | % |
| |
|
|
|
|
|
|
|
|
|
|
|
|
| ||||||||
Institutional & PWM Fixed Income |
|
|
|
|
|
|
|
|
|
|
| |||||||||
Beginning of period assets |
| $ | 32 |
|
| $ | 32 |
|
| $ | 32 |
|
|
|
|
|
| |||
| Inflows |
|
| - |
|
|
| - |
|
|
| - |
|
|
|
|
|
| ||
| Outflows |
|
| - |
|
|
| - |
|
|
| - |
|
|
|
|
|
| ||
| Net inflows (outflows) |
|
| - |
|
|
| - |
|
|
| - |
|
|
|
|
|
| ||
| Market appreciation (depreciation) |
|
| - |
|
|
| - |
|
|
| - |
|
|
|
|
|
| ||
| Total increase (decrease) |
|
| - |
|
|
| - |
|
|
| - |
|
|
|
|
|
| ||
Assets under management, end of period |
| $ | 32 |
|
| $ | 32 |
|
| $ | 32 |
|
| 0.0 | % |
| 0.0 | % |
| |
Percentage of total assets under management |
|
| 0.1 | % |
|
| 0.1 | % |
|
| 0.1 | % |
|
|
|
|
| |||
Average assets under management |
| $ | 32 |
|
| $ | 32 |
|
| $ | 32 |
|
| 0.0 | % |
| 0.0 | % |
| |
|
|
|
|
|
|
|
|
|
|
|
|
| ||||||||
Total Treasuries & Fixed Income |
|
|
|
|
|
|
|
|
|
|
| |||||||||
Beginning of period assets |
| $ | 4,249 |
|
| $ | 3,628 |
|
| $ | 2,747 |
|
|
|
|
|
| |||
| Inflows |
|
| 1,424 |
|
|
| 1,297 |
|
|
| 1,340 |
|
|
|
|
|
| ||
| Outflows |
|
| (1,088 | ) |
|
| (728 | ) |
|
| (1,615 | ) |
|
|
|
|
| ||
| Net inflows (outflows) |
|
| 336 |
|
|
| 569 |
|
|
| (275 | ) |
|
|
|
|
| ||
| Market appreciation (depreciation) |
|
| 62 |
|
|
| 52 |
|
|
| 22 |
|
|
|
|
|
| ||
| Total increase (decrease) |
|
| 398 |
|
|
| 621 |
|
|
| (253 | ) |
|
|
|
|
| ||
Assets under management, end of period |
| $ | 4,647 |
|
| $ | 4,249 |
|
| $ | 2,494 |
|
| 9.4 | % |
| 86.3 | % |
| |
Percentage of total assets under management |
|
| 14.9 | % |
|
| 14.6 | % |
|
| 8.5 | % |
|
|
|
|
| |||
Average assets under management |
| $ | 4,450 |
|
| $ | 4,027 |
|
| $ | 2,586 |
|
| 10.5 | % |
| 72.1 | % |
| |
|
|
|
|
|
|
|
|
|
|
|
|
| ||||||||
Total AUM |
|
|
|
|
|
|
|
|
|
|
| |||||||||
Beginning of period assets |
| $ | 29,178 |
|
| $ | 30,719 |
|
| $ | 27,633 |
|
|
|
|
|
| |||
| Inflows |
|
| 1,738 |
|
|
| 1,597 |
|
|
| 1,700 |
|
|
|
|
|
| ||
| Outflows |
|
| (2,083 | ) |
|
| (1,701 | ) |
|
| (2,700 | ) |
|
|
|
|
| ||
| Net inflows (outflows) |
|
| (345 | ) |
|
| (104 | ) |
|
| (1,000 | ) |
|
|
|
|
| ||
| Market appreciation (depreciation) |
|
| 2,399 |
|
|
| (1,305 | ) |
|
| 2,780 |
|
|
|
|
|
| ||
| Fund distributions, net of reinvestment |
|
| (146 | ) |
|
| (132 | ) |
|
| (152 | ) |
|
|
|
|
| ||
| Total increase (decrease) |
|
| 1,908 |
|
|
| (1,541 | ) |
|
| 1,628 |
|
|
|
|
|
| ||
Assets under management, end of period |
| $ | 31,086 |
|
| $ | 29,178 |
|
| $ | 29,261 |
|
| 6.5 | % |
| 6.2 | % |
| |
Average assets under management |
| $ | 29,461 |
|
| $ | 30,789 |
|
| $ | 29,495 |
|
| -4.3 | % |
| -0.1 | % |
| |
|
|
|
|
|
|
|
|
|
|
|
|
| ||||||||
GAMCO Investors, Inc. and Subsidiaries |
|
|
| ||||||||||
Assets Under Management |
|
|
| ||||||||||
By investment vehicle |
|
|
|
|
|
|
| ||||||
(in millions) |
|
|
|
|
|
|
| ||||||
|
|
| Twelve Months Ended |
|
| ||||||||
|
|
| December 31, |
| December 31, |
|
|
| |||||
|
|
|
| 2023 |
|
|
| 2022 |
|
| % Change |
| |
Equities: |
|
|
|
|
|
|
| ||||||
Mutual Funds |
|
|
|
|
|
|
| ||||||
Beginning of period assets |
| $ | 8,140 |
|
| $ | 10,249 |
|
|
|
| ||
| Inflows |
|
| 711 |
|
|
| 890 |
|
|
|
| |
| Outflows |
|
| (1,616 | ) |
|
| (1,593 | ) |
|
|
| |
| Net inflows (outflows) |
|
| (905 | ) |
|
| (703 | ) |
|
|
| |
| Market appreciation (depreciation) |
|
| 772 |
|
|
| (1,365 | ) |
|
|
| |
| Fund distributions, net of reinvestment |
|
| (34 | ) |
|
| (41 | ) |
|
|
| |
| Total increase (decrease) |
|
| (167 | ) |
|
| (2,109 | ) |
|
|
| |
Assets under management, end of period |
| $ | 7,973 |
|
| $ | 8,140 |
|
| -2.1 | % |
| |
Percentage of total assets under management |
|
| 25.6 | % |
|
| 27.8 | % |
|
|
| ||
Average assets under management |
| $ | 8,035 |
|
| $ | 8,875 |
|
| -9.5 | % |
| |
|
|
|
|
|
|
|
|
| |||||
Closed-end Funds |
|
|
|
|
|
|
| ||||||
Beginning of period assets |
| $ | 7,046 |
|
| $ | 8,656 |
|
|
|
| ||
| Inflows |
|
| 41 |
|
|
| 135 |
|
|
|
| |
| Outflows |
|
| (130 | ) |
|
| (401 | ) |
|
|
| |
| Net inflows (outflows) |
|
| (89 | ) |
|
| (266 | ) |
|
|
| |
| Market appreciation (depreciation) |
|
| 654 |
|
|
| (828 | ) |
|
|
| |
| Fund distributions, net of reinvestment |
|
| (514 | ) |
|
| (516 | ) |
|
|
| |
| Total increase (decrease) |
|
| 51 |
|
|
| (1,610 | ) |
|
|
| |
Assets under management, end of period |
| $ | 7,097 |
|
| $ | 7,046 |
|
| 0.7 | % |
| |
Percentage of total assets under management |
|
| 22.8 | % |
|
| 24.1 | % |
|
|
| ||
Average assets under management |
| $ | 7,058 |
|
| $ | 7,508 |
|
| -6.0 | % |
| |
|
|
|
|
|
|
|
|
| |||||
Institutional & PWM |
|
|
|
|
|
|
| ||||||
Beginning of period assets |
| $ | 10,714 |
|
| $ | 13,497 |
|
|
|
| ||
| Inflows |
|
| 241 |
|
|
| 358 |
|
|
|
| |
| Outflows |
|
| (1,739 | ) |
|
| (1,568 | ) |
|
|
| |
| Net inflows (outflows) |
|
| (1,498 | ) |
|
| (1,210 | ) |
|
|
| |
| Market appreciation (depreciation) |
|
| 1,522 |
|
|
| (1,573 | ) |
|
|
| |
| Total increase (decrease) |
|
| 24 |
|
|
| (2,783 | ) |
|
|
| |
Assets under management, end of period |
| $ | 10,738 |
|
| $ | 10,714 |
|
| 0.2 | % |
| |
Percentage of total assets under management |
|
| 34.5 | % |
|
| 36.6 | % |
|
|
| ||
Average assets under management |
| $ | 10,670 |
|
| $ | 11,566 |
|
| -7.7 | % |
| |
|
|
|
|
|
|
|
|
| |||||
SICAV |
|
|
|
|
|
|
| ||||||
Beginning of period assets |
| $ | 867 |
|
| $ | 831 |
|
|
|
| ||
| Inflows |
|
| 357 |
|
|
| 537 |
|
|
|
| |
| Outflows |
|
| (624 | ) |
|
| (459 | ) |
|
|
| |
| Net inflows (outflows) |
|
| (267 | ) |
|
| 78 |
|
|
|
| |
| Market appreciation (depreciation) |
|
| 31 |
|
|
| (42 | ) |
|
|
| |
| Total increase (decrease) |
|
| (236 | ) |
|
| 36 |
|
|
|
| |
Assets under management, end of period |
| $ | 631 |
|
| $ | 867 |
|
| -27.2 | % |
| |
Percentage of total assets under management |
|
| 2.0 | % |
|
| 3.0 | % |
|
|
| ||
Average assets under management |
| $ | 694 |
|
| $ | 862 |
|
| -19.5 | % |
| |
|
|
|
|
|
|
|
|
| |||||
Total Equities |
|
|
|
|
|
|
| ||||||
Beginning of period assets |
| $ | 26,767 |
|
| $ | 33,233 |
|
|
|
| ||
| Inflows |
|
| 1,350 |
|
|
| 1,920 |
|
|
|
| |
| Outflows |
|
| (4,109 | ) |
|
| (4,021 | ) |
|
|
| |
| Net inflows (outflows) |
|
| (2,759 | ) |
|
| (2,101 | ) |
|
|
| |
| Market appreciation (depreciation) |
|
| 2,979 |
|
|
| (3,808 | ) |
|
|
| |
| Fund distributions, net of reinvestment |
|
| (548 | ) |
|
| (557 | ) |
|
|
| |
| Total increase (decrease) |
|
| (328 | ) |
|
| (6,466 | ) |
|
|
| |
Assets under management, end of period |
| $ | 26,439 |
|
| $ | 26,767 |
|
| -1.2 | % |
| |
Percentage of total assets under management |
|
| 85.1 | % |
|
| 91.5 | % |
|
|
| ||
Average assets under management |
| $ | 26,457 |
|
| $ | 28,811 |
|
| -8.2 | % |
| |
|
|
|
|
|
|
|
|
| |||||
|
|
|
|
|
|
|
|
| |||||
GAMCO Investors, Inc. and Subsidiaries |
|
|
| ||||||||||
Assets Under Management |
|
|
|
|
|
|
| ||||||
By investment vehicle - continued |
|
|
|
|
|
|
| ||||||
(in millions) |
|
|
|
|
|
|
| ||||||
|
|
| Twelve Months Ended |
|
| ||||||||
|
|
| December 31, |
| December 31, |
|
|
| |||||
|
|
|
| 2023 |
|
|
| 2022 |
|
| % Change |
| |
Fixed Income: |
|
|
|
|
|
|
| ||||||
100% U.S. Treasury fund |
|
|
|
|
|
|
| ||||||
Beginning of period assets |
| $ | 2,462 |
|
| $ | 1,717 |
|
|
|
| ||
| Inflows |
|
| 5,498 |
|
|
| 5,048 |
|
|
|
| |
| Outflows |
|
| (3,536 | ) |
|
| (4,339 | ) |
|
|
| |
| Net inflows (outflows) |
|
| 1,962 |
|
|
| 709 |
|
|
|
| |
| Market appreciation (depreciation) |
|
| 191 |
|
|
| 36 |
|
|
|
| |
| Total increase (decrease) |
|
| 2,153 |
|
|
| 745 |
|
|
|
| |
Assets under management, end of period |
| $ | 4,615 |
|
| $ | 2,462 |
|
| 87.4 | % |
| |
Percentage of total assets under management |
|
| 14.8 | % |
|
| 8.4 | % |
|
|
| ||
Average assets under management |
| $ | 3,823 |
|
| $ | 2,154 |
|
| 77.5 | % |
| |
|
|
|
|
|
|
|
|
| |||||
Institutional & PWM Fixed Income |
|
|
|
|
|
|
| ||||||
Beginning of period assets |
| $ | 32 |
|
| $ | 32 |
|
|
|
| ||
| Inflows |
|
| - |
|
|
| - |
|
|
|
| |
| Outflows |
|
| - |
|
|
| - |
|
|
|
| |
| Net inflows (outflows) |
|
| - |
|
|
| - |
|
|
|
| |
| Market appreciation (depreciation) |
|
| - |
|
|
| - |
|
|
|
| |
| Total increase (decrease) |
|
| - |
|
|
| - |
|
|
|
| |
Assets under management, end of period |
| $ | 32 |
|
| $ | 32 |
|
| 0.0 | % |
| |
Percentage of total assets under management |
|
| 0.1 | % |
|
| 0.1 | % |
|
|
| ||
Average assets under management |
| $ | 32 |
|
| $ | 32 |
|
| 0.0 | % |
| |
|
|
|
|
|
|
|
|
| |||||
Total Treasuries & Fixed Income |
|
|
|
|
|
|
| ||||||
Beginning of period assets |
| $ | 2,494 |
|
| $ | 1,749 |
|
|
|
| ||
| Inflows |
|
| 5,498 |
|
|
| 5,048 |
|
|
|
| |
| Outflows |
|
| (3,536 | ) |
|
| (4,339 | ) |
|
|
| |
| Net inflows (outflows) |
|
| 1,962 |
|
|
| 709 |
|
|
|
| |
| Market appreciation (depreciation) |
|
| 191 |
|
|
| 36 |
|
|
|
| |
| Total increase (decrease) |
|
| 2,153 |
|
|
| 745 |
|
|
|
| |
Assets under management, end of period |
| $ | 4,647 |
|
| $ | 2,494 |
|
| 86.3 | % |
| |
Percentage of total assets under management |
|
| 14.9 | % |
|
| 8.5 | % |
|
|
| ||
Average assets under management |
| $ | 3,855 |
|
| $ | 2,186 |
|
| 76.3 | % |
| |
|
|
|
|
|
|
|
|
| |||||
Total AUM |
|
|
|
|
|
|
| ||||||
Beginning of period assets |
| $ | 29,261 |
|
| $ | 34,982 |
|
|
|
| ||
| Inflows |
|
| 6,848 |
|
|
| 6,968 |
|
|
|
| |
| Outflows |
|
| (7,645 | ) |
|
| (8,360 | ) |
|
|
| |
| Net inflows (outflows) |
|
| (797 | ) |
|
| (1,392 | ) |
|
|
| |
| Market appreciation (depreciation) |
|
| 3,170 |
|
|
| (3,772 | ) |
|
|
| |
| Fund distributions, net of reinvestment |
|
| (548 | ) |
|
| (557 | ) |
|
|
| |
| Total increase (decrease) |
|
| 1,825 |
|
|
| (5,721 | ) |
|
|
| |
Assets under management, end of period |
| $ | 31,086 |
|
| $ | 29,261 |
|
| 6.2 | % |
| |
Average assets under management |
| $ | 30,312 |
|
| $ | 30,997 |
|
| -2.2 | % |
| |
|
|
|
|
|
|
|
|
| |||||
Contact: | Kieran Caterina |
| Chief Accounting Officer |
|
|
| For further information please visit |
| www.gabelli.com |

