
 Yahoo Finance
 Are Genetic Signatures Limited's (ASX:GSS) Fundamentals Good Enough to Warrant Buying Given The Stock's Recent Weakness?
Genetic Signatures (ASX:GSS) has had a rough three months with its share price down 16%. But if you pay close attention, you might find that its key financial indicators look quite decent, which could mean that the stock could potentially rise in the long-term given how markets usually reward more resilient long-term fundamentals. Specifically, we decided to study Genetic Signatures' ROE in this article.
Return on equity or ROE is a key measure used to assess how efficiently a company's management is utilizing the company's capital. In short, ROE shows the profit each dollar generates with respect to its shareholder investments.
See our latest analysis for Genetic Signatures
How To Calculate Return On Equity?
ROE can be calculated by using the formula:
Return on Equity = Net Profit (from continuing operations) ÷ Shareholders' Equity
So, based on the above formula, the ROE for Genetic Signatures is:
5.6% = AU$3.1m ÷ AU$55m (Based on the trailing twelve months to June 2022).
The 'return' is the yearly profit. One way to conceptualize this is that for each A$1 of shareholders' capital it has, the company made A$0.06 in profit.
What Is The Relationship Between ROE And Earnings Growth?
Thus far, we have learned that ROE measures how efficiently a company is generating its profits. We now need to evaluate how much profit the company reinvests or "retains" for future growth which then gives us an idea about the growth potential of the company. Generally speaking, other things being equal, firms with a high return on equity and profit retention, have a higher growth rate than firms that don’t share these attributes.
Genetic Signatures' Earnings Growth And 5.6% ROE
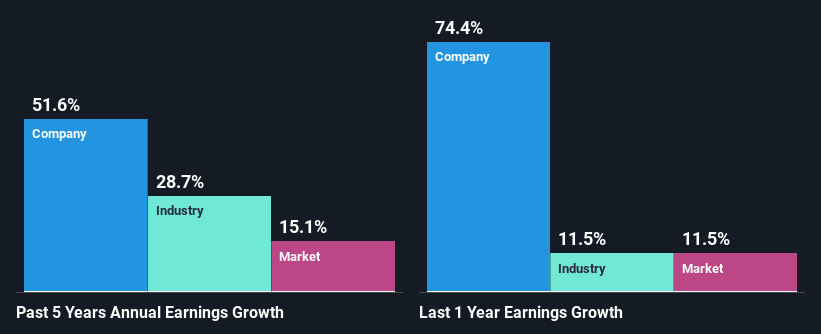
On the face of it, Genetic Signatures' ROE is not much to talk about. We then compared the company's ROE to the broader industry and were disappointed to see that the ROE is lower than the industry average of 12%. However, we we're pleasantly surprised to see that Genetic Signatures grew its net income at a significant rate of 52% in the last five years. Therefore, there could be other reasons behind this growth. Such as - high earnings retention or an efficient management in place.
Next, on comparing Genetic Signatures' net income growth with the industry, we found that the company's reported growth is similar to the industry average growth rate of 43% in the same period.
The basis for attaching value to a company is, to a great extent, tied to its earnings growth. The investor should try to establish if the expected growth or decline in earnings, whichever the case may be, is priced in. By doing so, they will have an idea if the stock is headed into clear blue waters or if swampy waters await. One good indicator of expected earnings growth is the P/E ratio which determines the price the market is willing to pay for a stock based on its earnings prospects. So, you may want to check if Genetic Signatures is trading on a high P/E or a low P/E, relative to its industry.
Is Genetic Signatures Efficiently Re-investing Its Profits?
Given that Genetic Signatures doesn't pay any dividend to its shareholders, we infer that the company has been reinvesting all of its profits to grow its business.
Conclusion
On the whole, we do feel that Genetic Signatures has some positive attributes. With a high rate of reinvestment, albeit at a low ROE, the company has managed to see a considerable growth in its earnings. With that said, on studying the latest analyst forecasts, we found that while the company has seen growth in its past earnings, analysts expect its future earnings to shrink. To know more about the latest analysts predictions for the company, check out this visualization of analyst forecasts for the company.
Have feedback on this article? Concerned about the content? Get in touch with us directly. Alternatively, email editorial-team (at) simplywallst.com.
This article by Simply Wall St is general in nature. We provide commentary based on historical data and analyst forecasts only using an unbiased methodology and our articles are not intended to be financial advice. It does not constitute a recommendation to buy or sell any stock, and does not take account of your objectives, or your financial situation. We aim to bring you long-term focused analysis driven by fundamental data. Note that our analysis may not factor in the latest price-sensitive company announcements or qualitative material. Simply Wall St has no position in any stocks mentioned.
Join A Paid User Research Session
You’ll receive a US$30 Amazon Gift card for 1 hour of your time while helping us build better investing tools for the individual investors like yourself. Sign up here
