
 Yahoo Finance
 Investing in Fairfax Financial Holdings (TSE:FFH) three years ago would have delivered you a 189% gain
The worst result, after buying shares in a company (assuming no leverage), would be if you lose all the money you put in. But if you buy shares in a really great company, you can more than double your money. For instance the Fairfax Financial Holdings Limited (TSE:FFH) share price is 174% higher than it was three years ago. How nice for those who held the stock! The last week saw the share price soften some 2.3%.
Now it's worth having a look at the company's fundamentals too, because that will help us determine if the long term shareholder return has matched the performance of the underlying business.
See our latest analysis for Fairfax Financial Holdings
There is no denying that markets are sometimes efficient, but prices do not always reflect underlying business performance. By comparing earnings per share (EPS) and share price changes over time, we can get a feel for how investor attitudes to a company have morphed over time.
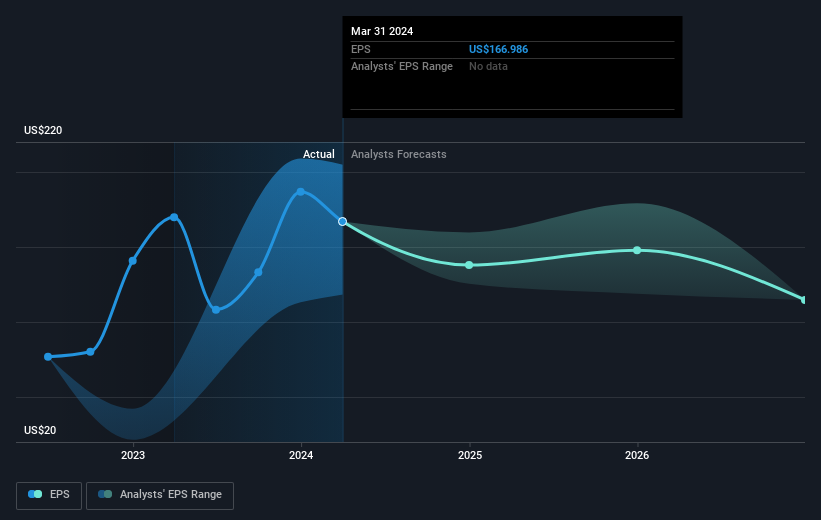
Fairfax Financial Holdings was able to grow its EPS at 26% per year over three years, sending the share price higher. This EPS growth is lower than the 40% average annual increase in the share price. This indicates that the market is feeling more optimistic on the stock, after the last few years of progress. It's not unusual to see the market 're-rate' a stock, after a few years of growth.
The graphic below depicts how EPS has changed over time (unveil the exact values by clicking on the image).
We like that insiders have been buying shares in the last twelve months. Even so, future earnings will be far more important to whether current shareholders make money. Before buying or selling a stock, we always recommend a close examination of historic growth trends, available here..
What About Dividends?
As well as measuring the share price return, investors should also consider the total shareholder return (TSR). The TSR is a return calculation that accounts for the value of cash dividends (assuming that any dividend received was reinvested) and the calculated value of any discounted capital raisings and spin-offs. So for companies that pay a generous dividend, the TSR is often a lot higher than the share price return. As it happens, Fairfax Financial Holdings' TSR for the last 3 years was 189%, which exceeds the share price return mentioned earlier. And there's no prize for guessing that the dividend payments largely explain the divergence!
A Different Perspective
We're pleased to report that Fairfax Financial Holdings shareholders have received a total shareholder return of 56% over one year. Of course, that includes the dividend. That's better than the annualised return of 21% over half a decade, implying that the company is doing better recently. Someone with an optimistic perspective could view the recent improvement in TSR as indicating that the business itself is getting better with time. It's always interesting to track share price performance over the longer term. But to understand Fairfax Financial Holdings better, we need to consider many other factors. For instance, we've identified 2 warning signs for Fairfax Financial Holdings (1 shouldn't be ignored) that you should be aware of.
If you like to buy stocks alongside management, then you might just love this free list of companies. (Hint: most of them are flying under the radar).
Please note, the market returns quoted in this article reflect the market weighted average returns of stocks that currently trade on Canadian exchanges.
Have feedback on this article? Concerned about the content? Get in touch with us directly. Alternatively, email editorial-team (at) simplywallst.com.
This article by Simply Wall St is general in nature. We provide commentary based on historical data and analyst forecasts only using an unbiased methodology and our articles are not intended to be financial advice. It does not constitute a recommendation to buy or sell any stock, and does not take account of your objectives, or your financial situation. We aim to bring you long-term focused analysis driven by fundamental data. Note that our analysis may not factor in the latest price-sensitive company announcements or qualitative material. Simply Wall St has no position in any stocks mentioned.
Have feedback on this article? Concerned about the content? Get in touch with us directly. Alternatively, email editorial-team@simplywallst.com
