
 Yahoo Finance
 Investing in National Grid (LON:NG.) five years ago would have delivered you a 64% gain
When we invest, we're generally looking for stocks that outperform the market average. And in our experience, buying the right stocks can give your wealth a significant boost. For example, the National Grid plc (LON:NG.) share price is up 26% in the last 5 years, clearly besting the market return of around 7.6% (ignoring dividends).
Now it's worth having a look at the company's fundamentals too, because that will help us determine if the long term shareholder return has matched the performance of the underlying business.
See our latest analysis for National Grid
To quote Buffett, 'Ships will sail around the world but the Flat Earth Society will flourish. There will continue to be wide discrepancies between price and value in the marketplace...' By comparing earnings per share (EPS) and share price changes over time, we can get a feel for how investor attitudes to a company have morphed over time.
National Grid's earnings per share are down 7.1% per year, despite strong share price performance over five years.
The strong decline in earnings per share suggests the market isn't using EPS to judge the company. Given that EPS is down, but the share price is up, it seems clear the market is focussed on other aspects of the business, at the moment.
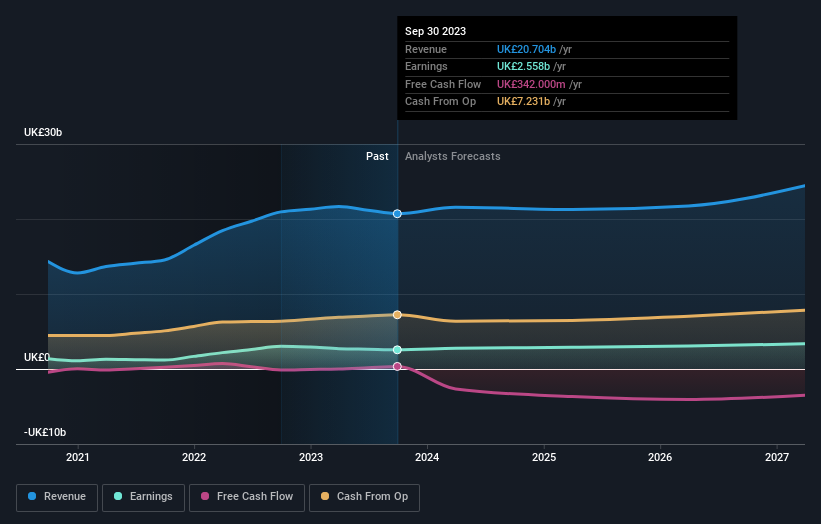
In fact, the dividend has increased over time, which is a positive. Maybe dividend investors have helped support the share price. We'd posit that the revenue growth over the last five years, of 9.5% per year, would encourage people to invest.
The graphic below depicts how earnings and revenue have changed over time (unveil the exact values by clicking on the image).
National Grid is a well known stock, with plenty of analyst coverage, suggesting some visibility into future growth. So it makes a lot of sense to check out what analysts think National Grid will earn in the future (free analyst consensus estimates)
What About Dividends?
When looking at investment returns, it is important to consider the difference between total shareholder return (TSR) and share price return. Whereas the share price return only reflects the change in the share price, the TSR includes the value of dividends (assuming they were reinvested) and the benefit of any discounted capital raising or spin-off. It's fair to say that the TSR gives a more complete picture for stocks that pay a dividend. In the case of National Grid, it has a TSR of 64% for the last 5 years. That exceeds its share price return that we previously mentioned. And there's no prize for guessing that the dividend payments largely explain the divergence!
A Different Perspective
While the broader market gained around 7.4% in the last year, National Grid shareholders lost 1.5% (even including dividends). However, keep in mind that even the best stocks will sometimes underperform the market over a twelve month period. On the bright side, long term shareholders have made money, with a gain of 10% per year over half a decade. If the fundamental data continues to indicate long term sustainable growth, the current sell-off could be an opportunity worth considering. It's always interesting to track share price performance over the longer term. But to understand National Grid better, we need to consider many other factors. Case in point: We've spotted 2 warning signs for National Grid you should be aware of, and 1 of them is potentially serious.
But note: National Grid may not be the best stock to buy. So take a peek at this free list of interesting companies with past earnings growth (and further growth forecast).
Please note, the market returns quoted in this article reflect the market weighted average returns of stocks that currently trade on British exchanges.
Have feedback on this article? Concerned about the content? Get in touch with us directly. Alternatively, email editorial-team (at) simplywallst.com.
This article by Simply Wall St is general in nature. We provide commentary based on historical data and analyst forecasts only using an unbiased methodology and our articles are not intended to be financial advice. It does not constitute a recommendation to buy or sell any stock, and does not take account of your objectives, or your financial situation. We aim to bring you long-term focused analysis driven by fundamental data. Note that our analysis may not factor in the latest price-sensitive company announcements or qualitative material. Simply Wall St has no position in any stocks mentioned.
