
 Yahoo Finance
 Investors in Seeka (NZSE:SEK) have unfortunately lost 30% over the last five years
The main aim of stock picking is to find the market-beating stocks. But the main game is to find enough winners to more than offset the losers At this point some shareholders may be questioning their investment in Seeka Limited (NZSE:SEK), since the last five years saw the share price fall 43%. And some of the more recent buyers are probably worried, too, with the stock falling 22% in the last year. The last week also saw the share price slip down another 5.8%.
It's worthwhile assessing if the company's economics have been moving in lockstep with these underwhelming shareholder returns, or if there is some disparity between the two. So let's do just that.
View our latest analysis for Seeka
There is no denying that markets are sometimes efficient, but prices do not always reflect underlying business performance. One way to examine how market sentiment has changed over time is to look at the interaction between a company's share price and its earnings per share (EPS).
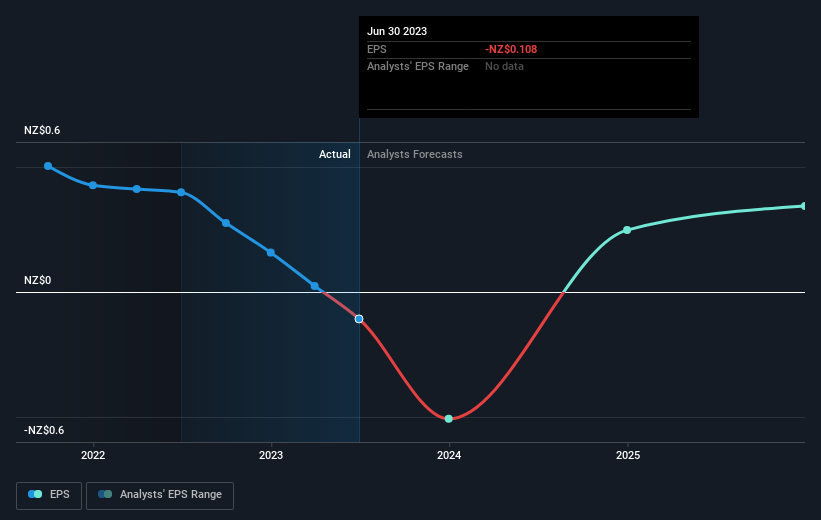
Over five years Seeka's earnings per share dropped significantly, falling to a loss, with the share price also lower. At present it's hard to make valid comparisons between EPS and the share price. But we would generally expect a lower price, given the situation.
The graphic below depicts how EPS has changed over time (unveil the exact values by clicking on the image).
Before buying or selling a stock, we always recommend a close examination of historic growth trends, available here.
What About The Total Shareholder Return (TSR)?
We've already covered Seeka's share price action, but we should also mention its total shareholder return (TSR). The TSR attempts to capture the value of dividends (as if they were reinvested) as well as any spin-offs or discounted capital raisings offered to shareholders. Its history of dividend payouts mean that Seeka's TSR, which was a 30% drop over the last 5 years, was not as bad as the share price return.
A Different Perspective
Investors in Seeka had a tough year, with a total loss of 22%, against a market gain of about 0.3%. Even the share prices of good stocks drop sometimes, but we want to see improvements in the fundamental metrics of a business, before getting too interested. Regrettably, last year's performance caps off a bad run, with the shareholders facing a total loss of 5% per year over five years. Generally speaking long term share price weakness can be a bad sign, though contrarian investors might want to research the stock in hope of a turnaround. I find it very interesting to look at share price over the long term as a proxy for business performance. But to truly gain insight, we need to consider other information, too. Consider for instance, the ever-present spectre of investment risk. We've identified 2 warning signs with Seeka (at least 1 which makes us a bit uncomfortable) , and understanding them should be part of your investment process.
If you would prefer to check out another company -- one with potentially superior financials -- then do not miss this free list of companies that have proven they can grow earnings.
Please note, the market returns quoted in this article reflect the market weighted average returns of stocks that currently trade on New Zealander exchanges.
Have feedback on this article? Concerned about the content? Get in touch with us directly. Alternatively, email editorial-team (at) simplywallst.com.
This article by Simply Wall St is general in nature. We provide commentary based on historical data and analyst forecasts only using an unbiased methodology and our articles are not intended to be financial advice. It does not constitute a recommendation to buy or sell any stock, and does not take account of your objectives, or your financial situation. We aim to bring you long-term focused analysis driven by fundamental data. Note that our analysis may not factor in the latest price-sensitive company announcements or qualitative material. Simply Wall St has no position in any stocks mentioned.
