
 Yahoo Finance
 Investors in South Port New Zealand (NZSE:SPN) have unfortunately lost 28% over the last three years
In order to justify the effort of selecting individual stocks, it's worth striving to beat the returns from a market index fund. But the risk of stock picking is that you will likely buy under-performing companies. Unfortunately, that's been the case for longer term South Port New Zealand Limited (NZSE:SPN) shareholders, since the share price is down 36% in the last three years, falling well short of the market decline of around 6.1%. The more recent news is of little comfort, with the share price down 24% in a year. Furthermore, it's down 20% in about a quarter. That's not much fun for holders.
It's worthwhile assessing if the company's economics have been moving in lockstep with these underwhelming shareholder returns, or if there is some disparity between the two. So let's do just that.
Check out our latest analysis for South Port New Zealand
While the efficient markets hypothesis continues to be taught by some, it has been proven that markets are over-reactive dynamic systems, and investors are not always rational. By comparing earnings per share (EPS) and share price changes over time, we can get a feel for how investor attitudes to a company have morphed over time.
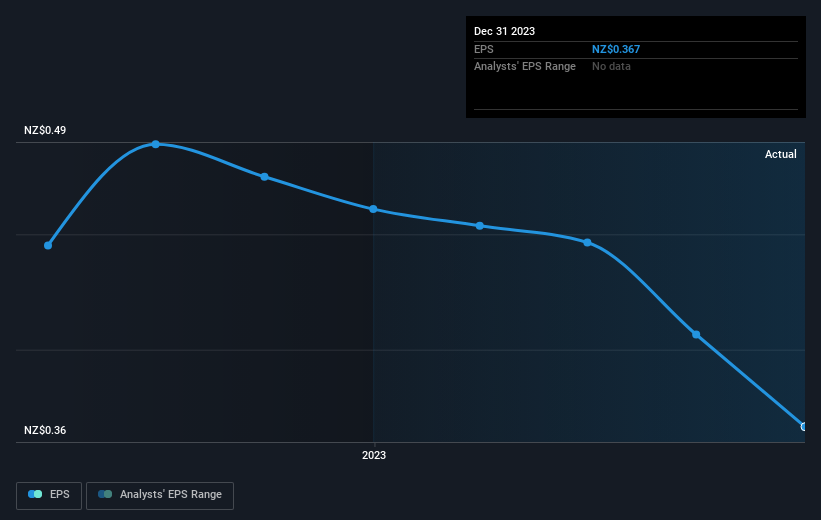
South Port New Zealand saw its EPS decline at a compound rate of 4.2% per year, over the last three years. The share price decline of 14% is actually steeper than the EPS slippage. So it seems the market was too confident about the business, in the past.
The company's earnings per share (over time) is depicted in the image below (click to see the exact numbers).
This free interactive report on South Port New Zealand's earnings, revenue and cash flow is a great place to start, if you want to investigate the stock further.
What About Dividends?
When looking at investment returns, it is important to consider the difference between total shareholder return (TSR) and share price return. The TSR is a return calculation that accounts for the value of cash dividends (assuming that any dividend received was reinvested) and the calculated value of any discounted capital raisings and spin-offs. So for companies that pay a generous dividend, the TSR is often a lot higher than the share price return. We note that for South Port New Zealand the TSR over the last 3 years was -28%, which is better than the share price return mentioned above. This is largely a result of its dividend payments!
A Different Perspective
While the broader market gained around 1.1% in the last year, South Port New Zealand shareholders lost 21% (even including dividends). Even the share prices of good stocks drop sometimes, but we want to see improvements in the fundamental metrics of a business, before getting too interested. Longer term investors wouldn't be so upset, since they would have made 1.2%, each year, over five years. If the fundamental data continues to indicate long term sustainable growth, the current sell-off could be an opportunity worth considering. It's always interesting to track share price performance over the longer term. But to understand South Port New Zealand better, we need to consider many other factors. Case in point: We've spotted 3 warning signs for South Port New Zealand you should be aware of.
If you like to buy stocks alongside management, then you might just love this free list of companies. (Hint: insiders have been buying them).
Please note, the market returns quoted in this article reflect the market weighted average returns of stocks that currently trade on New Zealander exchanges.
Have feedback on this article? Concerned about the content? Get in touch with us directly. Alternatively, email editorial-team (at) simplywallst.com.
This article by Simply Wall St is general in nature. We provide commentary based on historical data and analyst forecasts only using an unbiased methodology and our articles are not intended to be financial advice. It does not constitute a recommendation to buy or sell any stock, and does not take account of your objectives, or your financial situation. We aim to bring you long-term focused analysis driven by fundamental data. Note that our analysis may not factor in the latest price-sensitive company announcements or qualitative material. Simply Wall St has no position in any stocks mentioned.
