
 Yahoo Finance
 Medifast (MED) Q1 Earnings Miss Estimates, Revenues Fall Y/Y
Medifast, Inc. MED delivered first-quarter 2024 results, with the top and bottom lines declining year over year. While the bottom line missed the Zacks Consensus Estimate, the top line exceeded the same.
Medifast is strategically adjusting its operations to meet the changing demands of the weight-loss industry. This involves expanding its customer outreach through enhanced marketing efforts and entering the medically-supported weight-loss domain in partnership with LifeMD.
These steps are designed to increase its market presence and cater to a wider audience, highlighting a forward-looking approach aimed at driving growth and adapting to market dynamics despite the competitive landscape of the weight-loss sector.
Q1 in Detail
Medifast’s adjusted earnings were 66 cents per share in the first quarter of 2024. On a reported basis, the company’s earnings came in at 76 cents compared with $3.67 reported in the year-ago quarter. The bottom line missed the Zacks Consensus Estimate of 78 cents.
Net revenues of $174.7 million declined 49.9% year over year, mainly due to a fall in active earning OPTAVIA Coaches and reduced productivity per active earning OPTAVIA Coach. However, the top line surpassed the Zacks Consensus Estimate of $166 million.
MEDIFAST INC Price, Consensus and EPS Surprise
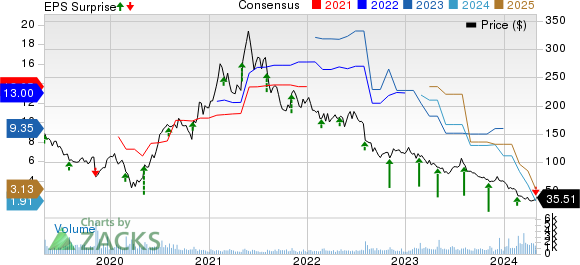
MEDIFAST INC price-consensus-eps-surprise-chart | MEDIFAST INC Quote
Average revenue per active earning OPTAVIA Coach was $4,623, down 22.2% from $5,945 due to lower customer acquisition. The total number of active earning OPTAVIA Coaches fell 35.6% to 37,800 compared with 58,700 in the year-ago quarter.
Gross profit came in at $127.3 million, down 48.3% year over year on reduced revenues. The gross profit margin was 72.8%, up 220 basis points (bps) year over year. This uptick mainly resulted from cost reductions achieved through MED’s Fuel for the Future initiative, partially offset by increased shipping costs and efficient management of inventory.
Selling, general and administrative (SG&A) expenses fell 38.1% year over year to $119.4 million. The decrease was caused by several factors, including reduced Coach compensation due to lower sales volumes and fewer active earning Coaches, as well as the progress made in various cost reduction and optimization initiatives.
As a percentage of revenues, SG&A expenses increased 1300 bps to 68.3%. This was primarily attributed to market research and investment costs related to medically supported weight loss activities, reduced leverage on fixed costs resulting from decreased sales volumes, as well as costs associated with company-led acquisition initiatives.
On a non-GAAP basis, adjusted SG&A expenses declined 38.8% to $118 million, while as a percentage of sales, the metric expanded 1,220 bps to 67.5%.
We had expected adjusted SG&A expenses, as a percentage of revenues, to increase 1,390 bps to 69.2% in the first quarter.
Adjusted income from operations declined 82.7% to $9.3 million, mainly due to a decrease in gross profit. However, this was partially mitigated by reduced SG&A expenses. Adjusted operating margin decreased 1000 bps year over year to 5.3%.
Other Financial Updates
Medifast concluded the quarter with cash, cash equivalents and investments of $156.4 million, no interest-bearing debt (as of Mar 31, 2024) and total shareholders’ equity of $211 million.
Guidance
Management expects revenues in the range of $150-$170 million for second-quarter 2024. The company projects earnings per share (EPS) in the band of 5-40 cents for the second quarter. The EPS guidance excludes costs associated with the initiation of partnership with LifeMD, as well as any gains or losses related to changes in the market price of the company’s LifeMD investment.
This Zacks Rank #5 (Strong Sell) company’s shares have lost 47.2% in the year-to-date period against the industry’s 3.6% growth.
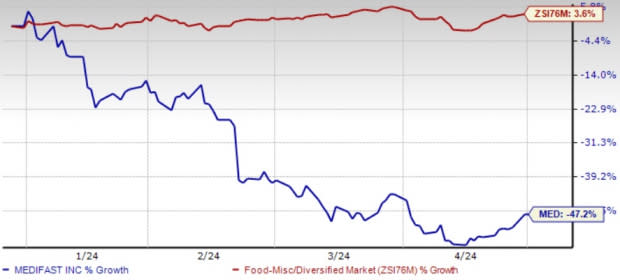
Image Source: Zacks Investment Research
Key Picks
Here, we have highlighted three better-ranked stocks, namely, Colgate-Palmolive CL, Vital Farms Inc. VITL and Vita Coco Company COCO.
Colgate-Palmolive, which manufactures and sells consumer products, currently carries a Zacks Rank #2 (Buy). CL delivered an earnings surprise of 4.4% in the trailing four quarters, on average. You can see the complete list of today’s Zacks #1 Rank (Strong Buy) stocks here.
The Zacks Consensus Estimate for Colgate-Palmolive’s current fiscal-year sales and earnings suggests growth of 3.6% and nearly 11.7%, respectively, from the year-ago reported numbers.
Vital Farms offers a range of produced pasture-raised foods. It currently carries a Zacks Rank #2. VITL has a trailing four-quarter earnings surprise of 155.4%, on average.
The Zacks Consensus Estimate for Vital Farms’ current financial-year sales and earnings suggests growth of 15% and nearly 43.8%, respectively, from the year-ago reported numbers
Vita Coco Company, which develops, markets and distributes coconut water products, currently carries a Zacks Rank #2. COCO has a trailing four-quarter earnings surprise of 31.3%, on average.
The Zacks Consensus Estimate for Vita Coco’s current financial-year sales and earnings suggests growth of 1.2% and 58.3%, respectively, from the year-ago reported numbers.
Want the latest recommendations from Zacks Investment Research? Today, you can download 7 Best Stocks for the Next 30 Days. Click to get this free report
Vita Coco Company, Inc. (COCO) : Free Stock Analysis Report
Colgate-Palmolive Company (CL) : Free Stock Analysis Report
MEDIFAST INC (MED) : Free Stock Analysis Report
Vital Farms, Inc. (VITL) : Free Stock Analysis Report
