NZD/USD Forex Technical Analysis – Downtrending Gann Angle at .6722 Last Potential Resistance Before .6791 Main Top
The trade sensitive New Zealand Dollar rose on Friday as optimism over the recently announced Phase One trade deal between the United States and China continued to lift investor appetite for risky assets. At the same time, demand for the safe-haven greenback fell on reduced needs for hedge protection. The Kiwi also remained supported by reduced chances of a February rate cut by the Reserve Bank of New Zealand.
On Friday, the NZD/USD settled at .6704, up 0.0033 or +0.49%.

Daily Swing Chart Technical Analysis
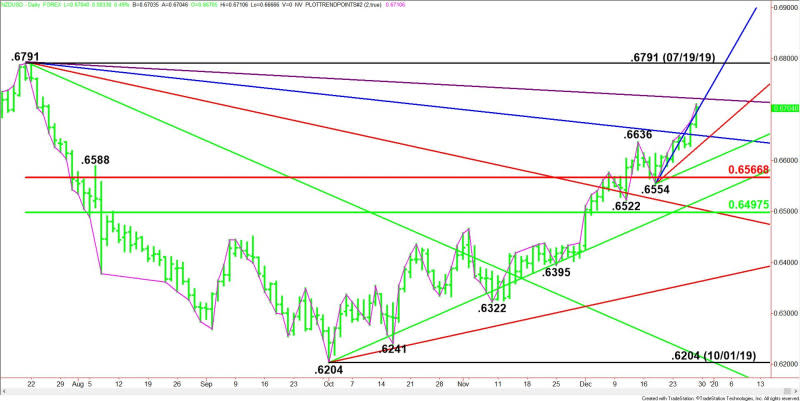
The main trend is up according to the daily swing chart. The uptrend was reaffirmed earlier this week when buyers took out the last swing top at .6636. The main trend will change to down on a trade through the last swing bottom at .6554.
The NZD/USD is up seven sessions from .6554, which puts it in the window of time for a closing price reversal top. This chart pattern won’t indicate a change in trend, but it will signal the selling is greater than the buying at current price levels. If confirmed, we could see a 2 to 3 day correction.
Daily Retracement Zone Technical Analysis
The main range is .6791 to .6204. Its retracement zone is .6567 to .6497. This zone is support. It’s also controlling the near-term direction of the Forex pair. Holding above the upper or Fibonacci level of this zone at .6567 will help sustain the upside bias.
Daily Gann Angle Technical Analysis
The NZD/USD closed on the strong side of a steep uptrending Gann angle at .6694. This puts it in a position to challenge a downtrending Gann angle at .6722. This is the last potential resistance angle before the .6791 main top.
If the steep uptrending Gann angle at .6694 fails to hold as support then look for a short-term pullback into a downtrending Gann angle at .6651, followed by another uptrending Gann angle at .6624.
This article was originally posted on FX Empire
More From FXEMPIRE:
Gold Price Prediction – Prices Form Doji Day but Trend Remains Positive
USD/JPY Weekly Price Forecast – US Dollar Stalls At Major Barrier
Natural Gas Weekly Price Forecast – Natural Gas Markets Slump
EUR/USD Weekly Price Forecast – Euro Testing Top Of Downtrend Channel
S&P 500 Weekly Price Forecast – Stock Markets Continue To March Higher

 Yahoo Finance