
 Yahoo Finance
 What Can We Make Of Saputo Inc.’s (TSE:SAP) High Return On Capital?

Want to participate in a short research study? Help shape the future of investing tools and you could win a $250 gift card!
Today we’ll evaluate Saputo Inc. (TSE:SAP) to determine whether it could have potential as an investment idea. To be precise, we’ll consider its Return On Capital Employed (ROCE), as that will inform our view of the quality of the business.
First up, we’ll look at what ROCE is and how we calculate it. Next, we’ll compare it to others in its industry. Finally, we’ll look at how its current liabilities affect its ROCE.
What is Return On Capital Employed (ROCE)?
ROCE is a metric for evaluating how much pre-tax income (in percentage terms) a company earns on the capital invested in its business. Generally speaking a higher ROCE is better. In brief, it is a useful tool, but it is not without drawbacks. Renowned investment researcher Michael Mauboussin has suggested that a high ROCE can indicate that ‘one dollar invested in the company generates value of more than one dollar’.
How Do You Calculate Return On Capital Employed?
The formula for calculating the return on capital employed is:
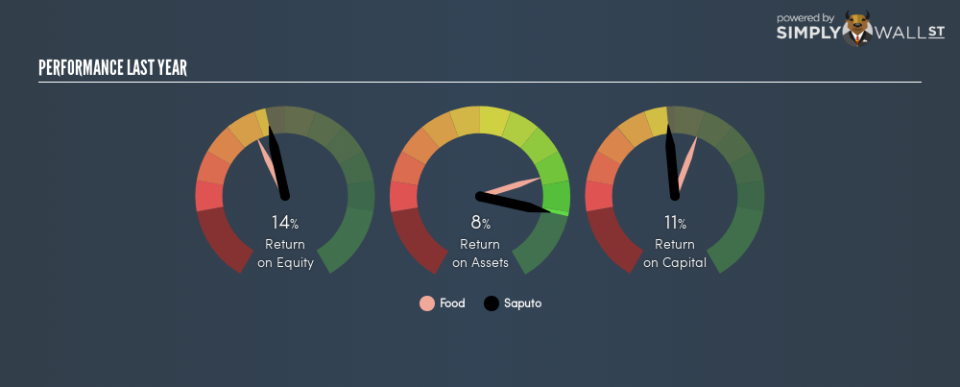
Return on Capital Employed = Earnings Before Interest and Tax (EBIT) ÷ (Total Assets – Current Liabilities)
Or for Saputo:
0.11 = CA$1.0b ÷ (CA$10b – CA$2.0b) (Based on the trailing twelve months to December 2018.)
So, Saputo has an ROCE of 11%.
View our latest analysis for Saputo
Is Saputo’s ROCE Good?
ROCE is commonly used for comparing the performance of similar businesses. Using our data, we find that Saputo’s ROCE is meaningfully better than the 9.0% average in the Food industry. We would consider this a positive, as it suggests it is using capital more effectively than other similar companies. Independently of how Saputo compares to its industry, its ROCE in absolute terms appears decent, and the company may be worthy of closer investigation.
It is important to remember that ROCE shows past performance, and is not necessarily predictive. ROCE can be deceptive for cyclical businesses, as returns can look incredible in boom times, and terribly low in downturns. This is because ROCE only looks at one year, instead of considering returns across a whole cycle. What happens in the future is pretty important for investors, so we have prepared a free report on analyst forecasts for Saputo.
What Are Current Liabilities, And How Do They Affect Saputo’s ROCE?
Current liabilities are short term bills and invoices that need to be paid in 12 months or less. Due to the way ROCE is calculated, a high level of current liabilities makes a company look as though it has less capital employed, and thus can (sometimes unfairly) boost the ROCE. To counter this, investors can check if a company has high current liabilities relative to total assets.
Saputo has total liabilities of CA$2.0b and total assets of CA$10b. Therefore its current liabilities are equivalent to approximately 20% of its total assets. A fairly low level of current liabilities is not influencing the ROCE too much.
The Bottom Line On Saputo’s ROCE
This is good to see, and with a sound ROCE, Saputo could be worth a closer look. But note: Saputo may not be the best stock to buy. So take a peek at this free list of interesting companies with strong recent earnings growth (and a P/E ratio below 20).
If you like to buy stocks alongside management, then you might just love this free list of companies. (Hint: insiders have been buying them).
To help readers see past the short term volatility of the financial market, we aim to bring you a long-term focused research analysis purely driven by fundamental data. Note that our analysis does not factor in the latest price-sensitive company announcements.
The author is an independent contributor and at the time of publication had no position in the stocks mentioned. For errors that warrant correction please contact the editor at editorial-team@simplywallst.com.
