
 Yahoo Finance
 The total return for Tempur Sealy International (NYSE:TPX) investors has risen faster than earnings growth over the last five years
The most you can lose on any stock (assuming you don't use leverage) is 100% of your money. But on a lighter note, a good company can see its share price rise well over 100%. For instance, the price of Tempur Sealy International, Inc. (NYSE:TPX) stock is up an impressive 236% over the last five years. Also pleasing for shareholders was the 12% gain in the last three months. But this move may well have been assisted by the reasonably buoyant market (up 11% in 90 days).
While this past week has detracted from the company's five-year return, let's look at the recent trends of the underlying business and see if the gains have been in alignment.
Check out our latest analysis for Tempur Sealy International
To paraphrase Benjamin Graham: Over the short term the market is a voting machine, but over the long term it's a weighing machine. One imperfect but simple way to consider how the market perception of a company has shifted is to compare the change in the earnings per share (EPS) with the share price movement.
Over half a decade, Tempur Sealy International managed to grow its earnings per share at 31% a year. This EPS growth is reasonably close to the 27% average annual increase in the share price. Therefore one could conclude that sentiment towards the shares hasn't morphed very much. Rather, the share price has approximately tracked EPS growth.
The image below shows how EPS has tracked over time (if you click on the image you can see greater detail).
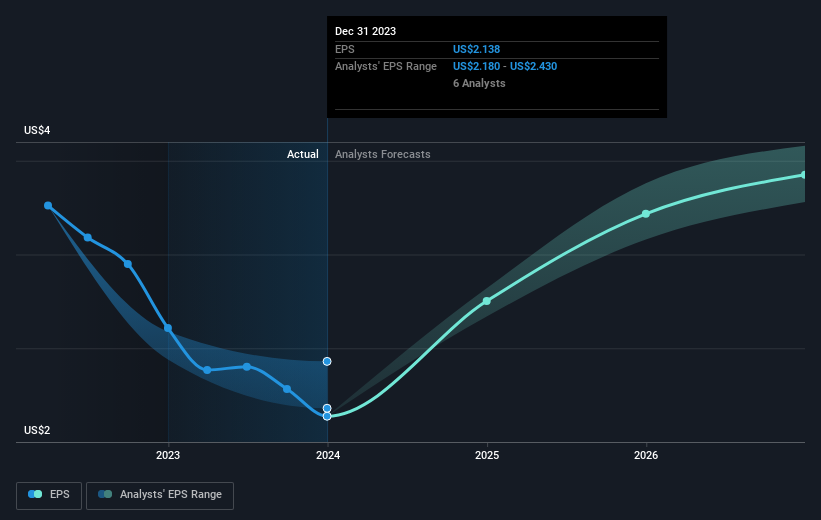
Before buying or selling a stock, we always recommend a close examination of historic growth trends, available here.
What About Dividends?
It is important to consider the total shareholder return, as well as the share price return, for any given stock. The TSR is a return calculation that accounts for the value of cash dividends (assuming that any dividend received was reinvested) and the calculated value of any discounted capital raisings and spin-offs. Arguably, the TSR gives a more comprehensive picture of the return generated by a stock. In the case of Tempur Sealy International, it has a TSR of 248% for the last 5 years. That exceeds its share price return that we previously mentioned. This is largely a result of its dividend payments!
A Different Perspective
We're pleased to report that Tempur Sealy International shareholders have received a total shareholder return of 47% over one year. And that does include the dividend. That's better than the annualised return of 28% over half a decade, implying that the company is doing better recently. Someone with an optimistic perspective could view the recent improvement in TSR as indicating that the business itself is getting better with time. It's always interesting to track share price performance over the longer term. But to understand Tempur Sealy International better, we need to consider many other factors. Even so, be aware that Tempur Sealy International is showing 2 warning signs in our investment analysis , you should know about...
If you like to buy stocks alongside management, then you might just love this free list of companies. (Hint: insiders have been buying them).
Please note, the market returns quoted in this article reflect the market weighted average returns of stocks that currently trade on American exchanges.
Have feedback on this article? Concerned about the content? Get in touch with us directly. Alternatively, email editorial-team (at) simplywallst.com.
This article by Simply Wall St is general in nature. We provide commentary based on historical data and analyst forecasts only using an unbiased methodology and our articles are not intended to be financial advice. It does not constitute a recommendation to buy or sell any stock, and does not take account of your objectives, or your financial situation. We aim to bring you long-term focused analysis driven by fundamental data. Note that our analysis may not factor in the latest price-sensitive company announcements or qualitative material. Simply Wall St has no position in any stocks mentioned.
