
 Yahoo Finance
 Are Van de Velde NV’s (EBR:VAN) High Returns Really That Great?

Want to participate in a short research study? Help shape the future of investing tools and you could win a $250 gift card!
Today we are going to look at Van de Velde NV (EBR:VAN) to see whether it might be an attractive investment prospect. Specifically, we’ll consider its Return On Capital Employed (ROCE), since that will give us an insight into how efficiently the business can generate profits from the capital it requires.
First of all, we’ll work out how to calculate ROCE. Then we’ll compare its ROCE to similar companies. Last but not least, we’ll look at what impact its current liabilities have on its ROCE.
Understanding Return On Capital Employed (ROCE)
ROCE is a measure of a company’s yearly pre-tax profit (its return), relative to the capital employed in the business. In general, businesses with a higher ROCE are usually better quality. In brief, it is a useful tool, but it is not without drawbacks. Renowned investment researcher Michael Mauboussin has suggested that a high ROCE can indicate that ‘one dollar invested in the company generates value of more than one dollar’.
How Do You Calculate Return On Capital Employed?
The formula for calculating the return on capital employed is:
Return on Capital Employed = Earnings Before Interest and Tax (EBIT) ÷ (Total Assets – Current Liabilities)
Or for Van de Velde:
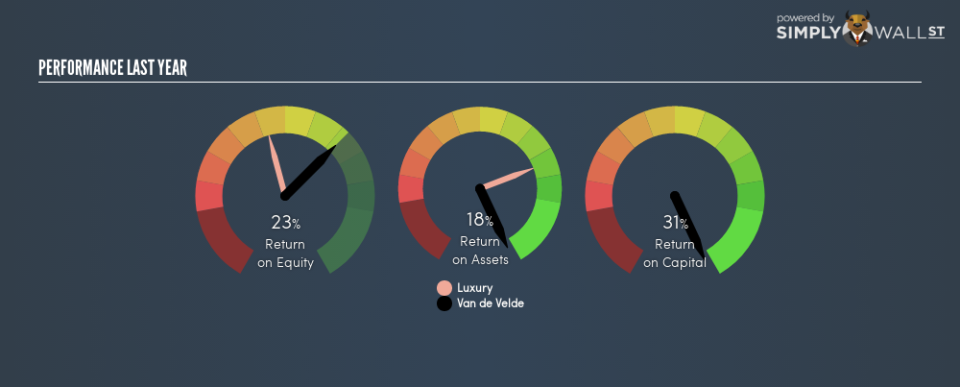
0.31 = €48m ÷ (€158m – €29m) (Based on the trailing twelve months to June 2018.)
So, Van de Velde has an ROCE of 31%.
See our latest analysis for Van de Velde
Does Van de Velde Have A Good ROCE?
ROCE is commonly used for comparing the performance of similar businesses. In our analysis, Van de Velde’s ROCE is meaningfully higher than the 12% average in the Luxury industry. We would consider this a positive, as it suggests it is using capital more effectively than other similar companies. Putting aside its position relative to its industry for now, in absolute terms, Van de Velde’s ROCE is currently very good.
When considering this metric, keep in mind that it is backwards looking, and not necessarily predictive. ROCE can be misleading for companies in cyclical industries, with returns looking impressive during the boom times, but very weak during the busts. This is because ROCE only looks at one year, instead of considering returns across a whole cycle. Future performance is what matters, and you can see analyst predictions in our free report on analyst forecasts for the company.
What Are Current Liabilities, And How Do They Affect Van de Velde’s ROCE?
Short term (or current) liabilities, are things like supplier invoices, overdrafts, or tax bills that need to be paid within 12 months. Due to the way ROCE is calculated, a high level of current liabilities makes a company look as though it has less capital employed, and thus can (sometimes unfairly) boost the ROCE. To counteract this, we check if a company has high current liabilities, relative to its total assets.
Van de Velde has total liabilities of €29m and total assets of €158m. Therefore its current liabilities are equivalent to approximately 18% of its total assets. A minimal amount of current liabilities limits the impact on ROCE.
Our Take On Van de Velde’s ROCE
With low current liabilities and a high ROCE, Van de Velde could be worthy of further investigation. Of course you might be able to find a better stock than Van de Velde. So you may wish to see this free collection of other companies that have grown earnings strongly.
If you are like me, then you will not want to miss this free list of growing companies that insiders are buying.
To help readers see past the short term volatility of the financial market, we aim to bring you a long-term focused research analysis purely driven by fundamental data. Note that our analysis does not factor in the latest price-sensitive company announcements.
The author is an independent contributor and at the time of publication had no position in the stocks mentioned. For errors that warrant correction please contact the editor at editorial-team@simplywallst.com.
