
 Yahoo Finance
 Viva Energy Group's (ASX:VEA) underlying earnings growth outpaced the notable return generated for shareholders over the past year
Passive investing in index funds can generate returns that roughly match the overall market. But if you pick the right individual stocks, you could make more than that. For example, the Viva Energy Group Limited (ASX:VEA) share price is up 21% in the last 1 year, clearly besting the market decline of around 7.5% (not including dividends). That's a solid performance by our standards! However, the longer term returns haven't been so impressive, with the stock up just 11% in the last three years.
Since the long term performance has been good but there's been a recent pullback of 5.6%, let's check if the fundamentals match the share price.
View our latest analysis for Viva Energy Group
While the efficient markets hypothesis continues to be taught by some, it has been proven that markets are over-reactive dynamic systems, and investors are not always rational. One flawed but reasonable way to assess how sentiment around a company has changed is to compare the earnings per share (EPS) with the share price.
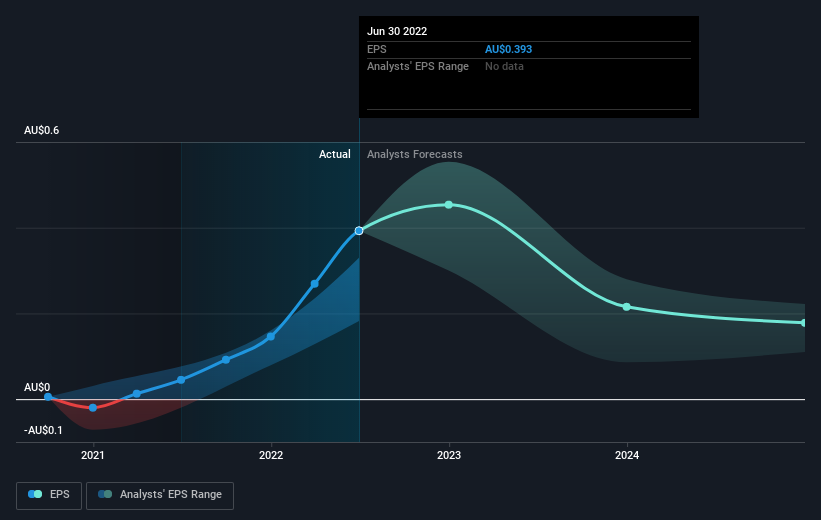
Viva Energy Group boasted truly magnificent EPS growth in the last year. We don't think the exact number is a good guide to the sustainable growth rate, but we do think this sort of increase is impressive. So we're unsurprised to see the share price gaining ground. Strong growth like this can be evidence of a fundamental inflection point in the business, making it a good time to investigate the stock more closely.
The company's earnings per share (over time) is depicted in the image below (click to see the exact numbers).
We know that Viva Energy Group has improved its bottom line lately, but is it going to grow revenue? Check if analysts think Viva Energy Group will grow revenue in the future.
What About Dividends?
As well as measuring the share price return, investors should also consider the total shareholder return (TSR). The TSR is a return calculation that accounts for the value of cash dividends (assuming that any dividend received was reinvested) and the calculated value of any discounted capital raisings and spin-offs. It's fair to say that the TSR gives a more complete picture for stocks that pay a dividend. We note that for Viva Energy Group the TSR over the last 1 year was 31%, which is better than the share price return mentioned above. And there's no prize for guessing that the dividend payments largely explain the divergence!
A Different Perspective
Pleasingly, Viva Energy Group's total shareholder return last year was 31%. That includes the value of the dividend. So this year's TSR was actually better than the three-year TSR (annualized) of 16%. The improving returns to shareholders suggests the stock is becoming more popular with time. While it is well worth considering the different impacts that market conditions can have on the share price, there are other factors that are even more important. Even so, be aware that Viva Energy Group is showing 1 warning sign in our investment analysis , you should know about...
If you are like me, then you will not want to miss this free list of growing companies that insiders are buying.
Please note, the market returns quoted in this article reflect the market weighted average returns of stocks that currently trade on AU exchanges.
Have feedback on this article? Concerned about the content? Get in touch with us directly. Alternatively, email editorial-team (at) simplywallst.com.
This article by Simply Wall St is general in nature. We provide commentary based on historical data and analyst forecasts only using an unbiased methodology and our articles are not intended to be financial advice. It does not constitute a recommendation to buy or sell any stock, and does not take account of your objectives, or your financial situation. We aim to bring you long-term focused analysis driven by fundamental data. Note that our analysis may not factor in the latest price-sensitive company announcements or qualitative material. Simply Wall St has no position in any stocks mentioned.
Join A Paid User Research Session
You’ll receive a US$30 Amazon Gift card for 1 hour of your time while helping us build better investing tools for the individual investors like yourself. Sign up here
