
 Yahoo Finance
 Why Federal Realty Investment Trust (NYSE:FRT) Looks Like A Quality Company

Want to participate in a short research study? Help shape the future of investing tools and you could win a $250 gift card!
While some investors are already well versed in financial metrics (hat tip), this article is for those who would like to learn about Return On Equity (ROE) and why it is important. We'll use ROE to examine Federal Realty Investment Trust (NYSE:FRT), by way of a worked example.
Our data shows Federal Realty Investment Trust has a return on equity of 9.4% for the last year. Another way to think of that is that for every $1 worth of equity in the company, it was able to earn $0.094.
See our latest analysis for Federal Realty Investment Trust
How Do You Calculate Return On Equity?
The formula for return on equity is:
Return on Equity = Net Profit ÷ Shareholders' Equity
Or for Federal Realty Investment Trust:
9.4% = US$232m ÷ US$2.6b (Based on the trailing twelve months to March 2019.)
Most readers would understand what net profit is, but it’s worth explaining the concept of shareholders’ equity. It is the capital paid in by shareholders, plus any retained earnings. You can calculate shareholders' equity by subtracting the company's total liabilities from its total assets.
What Does ROE Signify?
ROE measures a company's profitability against the profit it retains, and any outside investments. The 'return' is the yearly profit. A higher profit will lead to a higher ROE. So, all else being equal, a high ROE is better than a low one. That means ROE can be used to compare two businesses.
Does Federal Realty Investment Trust Have A Good ROE?
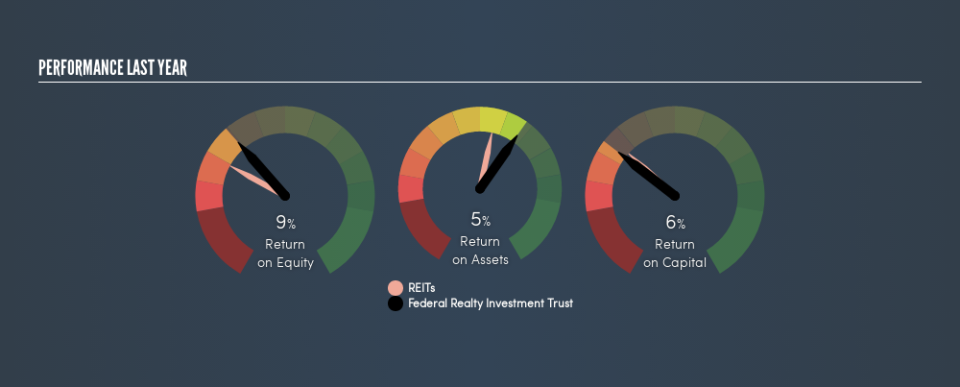
One simple way to determine if a company has a good return on equity is to compare it to the average for its industry. The limitation of this approach is that some companies are quite different from others, even within the same industry classification. As you can see in the graphic below, Federal Realty Investment Trust has a higher ROE than the average (6.2%) in the REITs industry.
That is a good sign. In my book, a high ROE almost always warrants a closer look. For example you might check if insiders are buying shares.
Why You Should Consider Debt When Looking At ROE
Most companies need money -- from somewhere -- to grow their profits. The cash for investment can come from prior year profits (retained earnings), issuing new shares, or borrowing. In the first two cases, the ROE will capture this use of capital to grow. In the latter case, the debt required for growth will boost returns, but will not impact the shareholders' equity. Thus the use of debt can improve ROE, albeit along with extra risk in the case of stormy weather, metaphorically speaking.
Federal Realty Investment Trust's Debt And Its 9.4% ROE
Federal Realty Investment Trust clearly uses a significant amount of debt to boost returns, as it has a debt to equity ratio of 1.22. While the ROE isn't too bad, it would probably be a lot lower if the company was forced to reduce debt. Investors should think carefully about how a company might perform if it was unable to borrow so easily, because credit markets do change over time.
The Bottom Line On ROE
Return on equity is useful for comparing the quality of different businesses. A company that can achieve a high return on equity without debt could be considered a high quality business. If two companies have around the same level of debt to equity, and one has a higher ROE, I'd generally prefer the one with higher ROE.
But ROE is just one piece of a bigger puzzle, since high quality businesses often trade on high multiples of earnings. It is important to consider other factors, such as future profit growth -- and how much investment is required going forward. So you might want to take a peek at this data-rich interactive graph of forecasts for the company.
Of course, you might find a fantastic investment by looking elsewhere. So take a peek at this free list of interesting companies.
We aim to bring you long-term focused research analysis driven by fundamental data. Note that our analysis may not factor in the latest price-sensitive company announcements or qualitative material.
If you spot an error that warrants correction, please contact the editor at editorial-team@simplywallst.com. This article by Simply Wall St is general in nature. It does not constitute a recommendation to buy or sell any stock, and does not take account of your objectives, or your financial situation. Simply Wall St has no position in the stocks mentioned. Thank you for reading.
