
 Yahoo Finance
 Should You Be Worried About Ingenia Communities Group's (ASX:INA) 4.7% Return On Equity?

While some investors are already well versed in financial metrics (hat tip), this article is for those who would like to learn about Return On Equity (ROE) and why it is important. By way of learning-by-doing, we'll look at ROE to gain a better understanding of Ingenia Communities Group (ASX:INA).
Over the last twelve months Ingenia Communities Group has recorded a ROE of 4.7%. That means that for every A$1 worth of shareholders' equity, it generated A$0.05 in profit.
View our latest analysis for Ingenia Communities Group
How Do I Calculate ROE?
The formula for ROE is:
Return on Equity = Net Profit ÷ Shareholders' Equity
Or for Ingenia Communities Group:
4.7% = AU$29m ÷ AU$626m (Based on the trailing twelve months to June 2019.)
Most know that net profit is the total earnings after all expenses, but the concept of shareholders' equity is a little more complicated. It is all earnings retained by the company, plus any capital paid in by shareholders. The easiest way to calculate shareholders' equity is to subtract the company's total liabilities from the total assets.
What Does ROE Signify?
ROE measures a company's profitability against the profit it retains, and any outside investments. The 'return' is the amount earned after tax over the last twelve months. The higher the ROE, the more profit the company is making. So, all else equal, investors should like a high ROE. That means ROE can be used to compare two businesses.
Does Ingenia Communities Group Have A Good Return On Equity?
Arguably the easiest way to assess company's ROE is to compare it with the average in its industry. Importantly, this is far from a perfect measure, because companies differ significantly within the same industry classification. As shown in the graphic below, Ingenia Communities Group has a lower ROE than the average (8.8%) in the REITs industry classification.
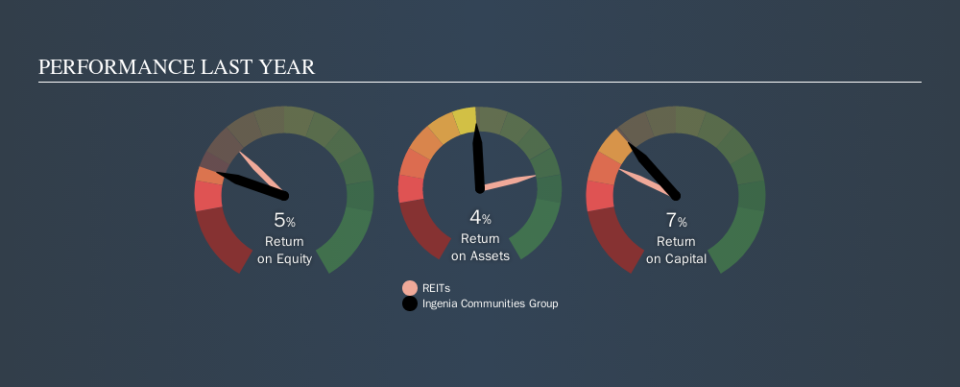
That's not what we like to see. We'd prefer see an ROE above the industry average, but it might not matter if the company is undervalued. Nonetheless, it might be wise to check if insiders have been selling.
How Does Debt Impact ROE?
Companies usually need to invest money to grow their profits. That cash can come from issuing shares, retained earnings, or debt. In the first two cases, the ROE will capture this use of capital to grow. In the latter case, the debt used for growth will improve returns, but won't affect the total equity. In this manner the use of debt will boost ROE, even though the core economics of the business stay the same.
Ingenia Communities Group's Debt And Its 4.7% ROE
Although Ingenia Communities Group does use debt, its debt to equity ratio of 0.39 is still low. Its ROE isn't particularly impressive, but the debt levels are quite modest, so the business probably has some real potential. Careful use of debt to boost returns is often very good for shareholders. However, it could reduce the company's ability to take advantage of future opportunities.
But It's Just One Metric
Return on equity is a useful indicator of the ability of a business to generate profits and return them to shareholders. Companies that can achieve high returns on equity without too much debt are generally of good quality. If two companies have the same ROE, then I would generally prefer the one with less debt.
But ROE is just one piece of a bigger puzzle, since high quality businesses often trade on high multiples of earnings. The rate at which profits are likely to grow, relative to the expectations of profit growth reflected in the current price, must be considered, too. So you might want to take a peek at this data-rich interactive graph of forecasts for the company.
Of course, you might find a fantastic investment by looking elsewhere. So take a peek at this free list of interesting companies.
We aim to bring you long-term focused research analysis driven by fundamental data. Note that our analysis may not factor in the latest price-sensitive company announcements or qualitative material.
If you spot an error that warrants correction, please contact the editor at editorial-team@simplywallst.com. This article by Simply Wall St is general in nature. It does not constitute a recommendation to buy or sell any stock, and does not take account of your objectives, or your financial situation. Simply Wall St has no position in the stocks mentioned. Thank you for reading.
