
 Yahoo Finance
 The 9.8% return this week takes adidas' (ETR:ADS) shareholders one-year gains to 40%
If you want to compound wealth in the stock market, you can do so by buying an index fund. But one can do better than that by picking better than average stocks (as part of a diversified portfolio). To wit, the adidas AG (ETR:ADS) share price is 39% higher than it was a year ago, much better than the market decline of around 0.3% (not including dividends) in the same period. That's a solid performance by our standards! Unfortunately the longer term returns are not so good, with the stock falling 15% in the last three years.
The past week has proven to be lucrative for adidas investors, so let's see if fundamentals drove the company's one-year performance.
See our latest analysis for adidas
While the efficient markets hypothesis continues to be taught by some, it has been proven that markets are over-reactive dynamic systems, and investors are not always rational. One imperfect but simple way to consider how the market perception of a company has shifted is to compare the change in the earnings per share (EPS) with the share price movement.
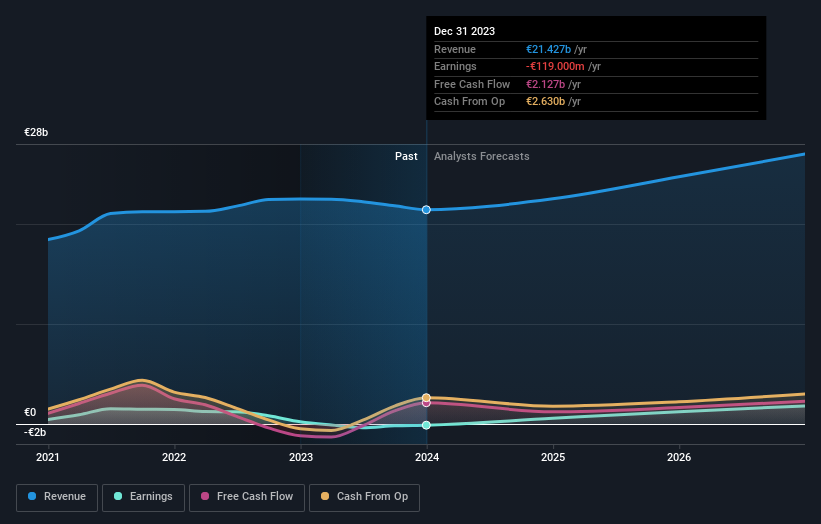
Over the last twelve months adidas went from profitable to unprofitable. While some may see this as temporary, we're a skeptical bunch, and so we're a little surprised to see the share price go up. We might get a clue to explain the share price move by looking to other metrics.
We are skeptical of the suggestion that the 0.3% dividend yield would entice buyers to the stock. adidas' revenue actually dropped 4.8% over last year. So the fundamental metrics don't provide an obvious explanation for the share price gain.
The image below shows how earnings and revenue have tracked over time (if you click on the image you can see greater detail).
adidas is well known by investors, and plenty of clever analysts have tried to predict the future profit levels. If you are thinking of buying or selling adidas stock, you should check out this free report showing analyst consensus estimates for future profits.
A Different Perspective
It's good to see that adidas has rewarded shareholders with a total shareholder return of 40% in the last twelve months. Of course, that includes the dividend. That's better than the annualised return of 0.6% over half a decade, implying that the company is doing better recently. In the best case scenario, this may hint at some real business momentum, implying that now could be a great time to delve deeper. Shareholders might want to examine this detailed historical graph of past earnings, revenue and cash flow.
But note: adidas may not be the best stock to buy. So take a peek at this free list of interesting companies with past earnings growth (and further growth forecast).
Please note, the market returns quoted in this article reflect the market weighted average returns of stocks that currently trade on German exchanges.
Have feedback on this article? Concerned about the content? Get in touch with us directly. Alternatively, email editorial-team (at) simplywallst.com.
This article by Simply Wall St is general in nature. We provide commentary based on historical data and analyst forecasts only using an unbiased methodology and our articles are not intended to be financial advice. It does not constitute a recommendation to buy or sell any stock, and does not take account of your objectives, or your financial situation. We aim to bring you long-term focused analysis driven by fundamental data. Note that our analysis may not factor in the latest price-sensitive company announcements or qualitative material. Simply Wall St has no position in any stocks mentioned.
