
 Yahoo Finance
 Can AAC Technologies Holdings Inc’s (HKG:2018) ROE Continue To Surpass The Industry Average?

I am writing today to help inform people who are new to the stock market and looking to gauge the potential return on investment in AAC Technologies Holdings Inc (HKG:2018).
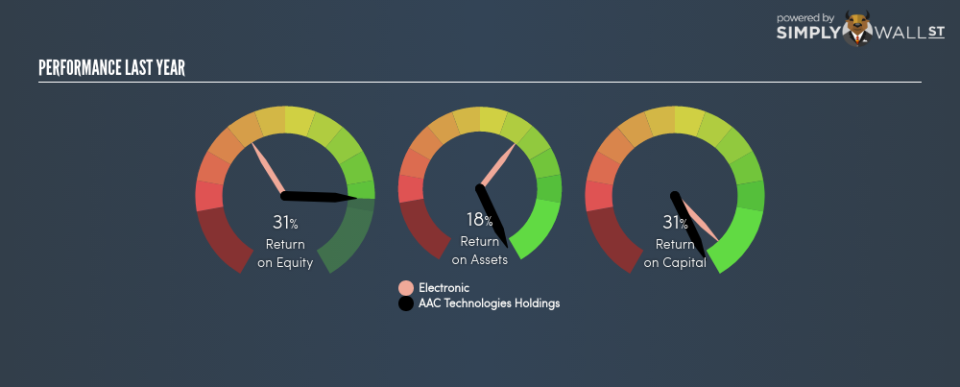
AAC Technologies Holdings Inc (HKG:2018) outperformed the Electronic Manufacturing Services industry on the basis of its ROE – producing a higher 30.71% relative to the peer average of 10.79% over the past 12 months. Superficially, this looks great since we know that 2018 has generated big profits with little equity capital; however, ROE doesn’t tell us how much 2018 has borrowed in debt. In this article, we’ll closely examine some factors like financial leverage to evaluate the sustainability of 2018’s ROE. See our latest analysis for AAC Technologies Holdings
Breaking down ROE — the mother of all ratios
Return on Equity (ROE) weighs AAC Technologies Holdings’s profit against the level of its shareholders’ equity. An ROE of 30.71% implies HK$0.31 returned on every HK$1 invested. Generally speaking, a higher ROE is preferred; however, there are other factors we must also consider before making any conclusions.
Return on Equity = Net Profit ÷ Shareholders Equity
ROE is assessed against cost of equity, which is measured using the Capital Asset Pricing Model (CAPM) – but let’s not dive into the details of that today. For now, let’s just look at the cost of equity number for AAC Technologies Holdings, which is 8.44%. This means AAC Technologies Holdings returns enough to cover its own cost of equity, with a buffer of 22.27%. This sustainable practice implies that the company pays less for its capital than what it generates in return. ROE can be split up into three useful ratios: net profit margin, asset turnover, and financial leverage. This is called the Dupont Formula:
Dupont Formula
ROE = profit margin × asset turnover × financial leverage
ROE = (annual net profit ÷ sales) × (sales ÷ assets) × (assets ÷ shareholders’ equity)
ROE = annual net profit ÷ shareholders’ equity
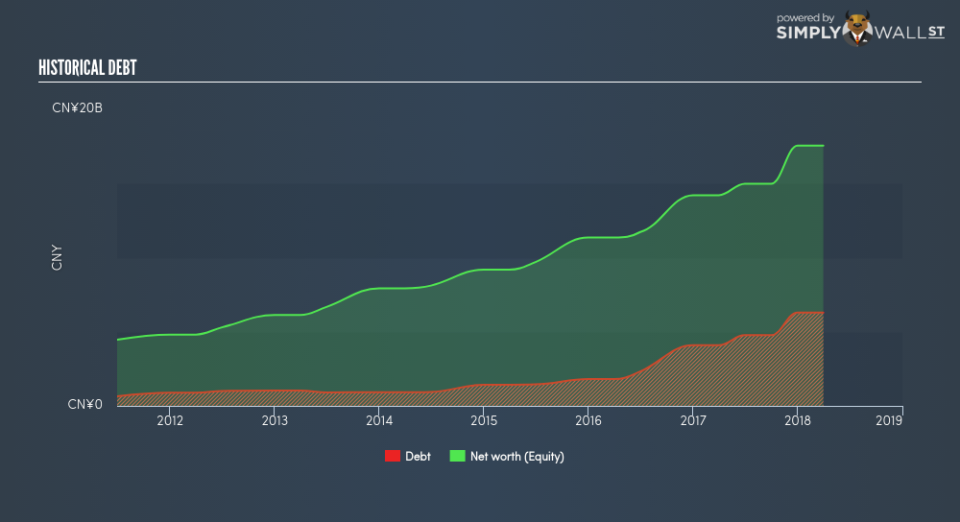
The first component is profit margin, which measures how much of sales is retained after the company pays for all its expenses. Asset turnover reveals how much revenue can be generated from AAC Technologies Holdings’s asset base. Finally, financial leverage will be our main focus today. It shows how much of assets are funded by equity and can show how sustainable the company’s capital structure is. Since ROE can be inflated by excessive debt, we need to examine AAC Technologies Holdings’s debt-to-equity level. At 35.84%, AAC Technologies Holdings’s debt-to-equity ratio appears low and indicates the above-average ROE is generated from its capacity to increase profit without a large debt burden.
Next Steps:
While ROE is a relatively simple calculation, it can be broken down into different ratios, each telling a different story about the strengths and weaknesses of a company. AAC Technologies Holdings’s ROE is impressive relative to the industry average and also covers its cost of equity. Its high ROE is not likely to be driven by high debt. Therefore, investors may have more confidence in the sustainability of this level of returns going forward. ROE is a helpful signal, but it is definitely not sufficient on its own to make an investment decision.
For AAC Technologies Holdings, I’ve put together three important factors you should further research:
Financial Health: Does it have a healthy balance sheet? Take a look at our free balance sheet analysis with six simple checks on key factors like leverage and risk.
Valuation: What is AAC Technologies Holdings worth today? Is the stock undervalued, even when its growth outlook is factored into its intrinsic value? The intrinsic value infographic in our free research report helps visualize whether AAC Technologies Holdings is currently mispriced by the market.
Other High-Growth Alternatives : Are there other high-growth stocks you could be holding instead of AAC Technologies Holdings? Explore our interactive list of stocks with large growth potential to get an idea of what else is out there you may be missing!
To help readers see pass the short term volatility of the financial market, we aim to bring you a long-term focused research analysis purely driven by fundamental data. Note that our analysis does not factor in the latest price sensitive company announcements.
The author is an independent contributor and at the time of publication had no position in the stocks mentioned.
