
 Yahoo Finance
 How Has ABB Ltd’s (VTX:ABBN) Earnings Fared Against The Long Term Trend

For investors with a long-term horizon, assessing earnings trend over time and against industry benchmarks is more valuable than looking at a single earnings announcement in one point in time. Investors may find my commentary, albeit very high-level and brief, on ABB Ltd (VTX:ABBN) useful as an attempt to give more color around how ABB is currently performing.
Check out our latest analysis for ABB
Did ABBN’s recent performance beat its trend and industry?
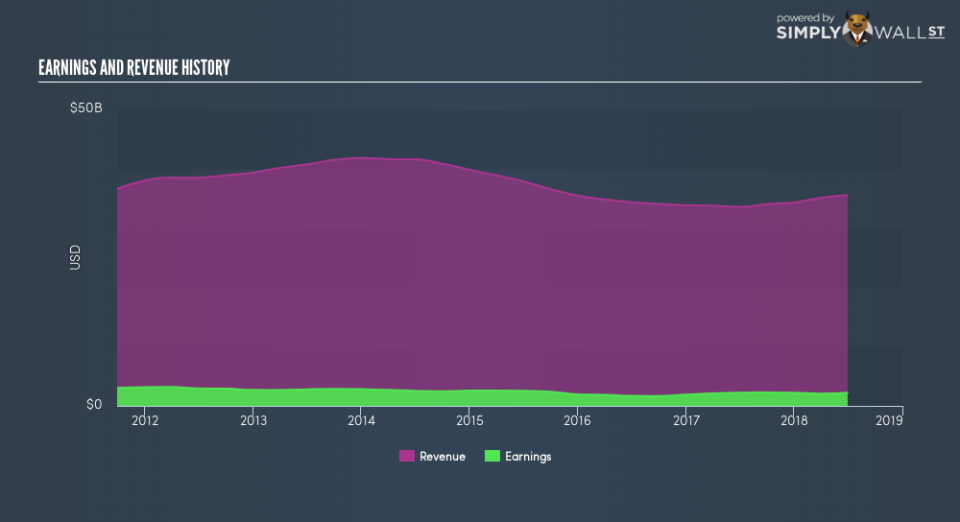
ABBN’s trailing twelve-month earnings (from 30 June 2018) of US$2.22b has declined by -0.27% compared to the previous year. Furthermore, this one-year growth rate has been lower than its average earnings growth rate over the past 5 years of -7.26%, indicating the rate at which ABBN is growing has slowed down. Why is this? Well, let’s look at what’s occurring with margins and whether the rest of the industry is feeling the heat.
Although revenue growth over the past couple of years, has been negative, earnings growth has been falling by even more, meaning ABB has been growing its expenses. This hurts margins and earnings, and is not a sustainable practice. Viewing growth from a sector-level, the CH electrical industry has been enduring some headwinds in the past year, leading to average earnings dropping by more than half. This is a a solid change, given that the industry has been delivering a relatively flat growth rate over the last few years. This growth is a median of profitable companies of 8 Electrical companies in CH including OSRAM Licht, Carlo Gavazzi Holding and Vestas Wind Systems. This means whatever recent headwind the industry is facing, ABB is relatively better-cushioned than its peers.
In terms of returns from investment, ABB has fallen short of achieving a 20% return on equity (ROE), recording 16.54% instead. Furthermore, its return on assets (ROA) of 5.45% is below the CH Electrical industry of 5.47%, indicating ABB’s are utilized less efficiently. However, its return on capital (ROC), which also accounts for ABB’s debt level, has increased over the past 3 years from 13.08% to 13.50%.
What does this mean?
ABB’s track record can be a valuable insight into its earnings performance, but it certainly doesn’t tell the whole story. Generally companies that experience a prolonged period of decline in earnings are going through some sort of reinvestment phase However, if the whole industry is struggling to grow over time, it may be a signal of a structural change, which makes ABB and its peers a riskier investment. I suggest you continue to research ABB to get a better picture of the stock by looking at:
Future Outlook: What are well-informed industry analysts predicting for ABBN’s future growth? Take a look at our free research report of analyst consensus for ABBN’s outlook.
Financial Health: Are ABBN’s operations financially sustainable? Balance sheets can be hard to analyze, which is why we’ve done it for you. Check out our financial health checks here.
Other High-Performing Stocks: Are there other stocks that provide better prospects with proven track records? Explore our free list of these great stocks here.
NB: Figures in this article are calculated using data from the trailing twelve months from 30 June 2018. This may not be consistent with full year annual report figures.
To help readers see past the short term volatility of the financial market, we aim to bring you a long-term focused research analysis purely driven by fundamental data. Note that our analysis does not factor in the latest price-sensitive company announcements.
The author is an independent contributor and at the time of publication had no position in the stocks mentioned. For errors that warrant correction please contact the editor at editorial-team@simplywallst.com.
