
 Yahoo Finance
 Is ABM Industries Incorporated (NYSE:ABM) A Financially Sound Company?

ABM Industries Incorporated (NYSE:ABM) is a small-cap stock with a market capitalization of US$2.00b. While investors primarily focus on the growth potential and competitive landscape of the small-cap companies, they end up ignoring a key aspect, which could be the biggest threat to its existence: its financial health. Why is it important? Assessing first and foremost the financial health is essential, since poor capital management may bring about bankruptcies, which occur at a higher rate for small-caps. Here are a few basic checks that are good enough to have a broad overview of the company’s financial strength. However, this commentary is still very high-level, so I suggest you dig deeper yourself into ABM here.
Does ABM produce enough cash relative to debt?
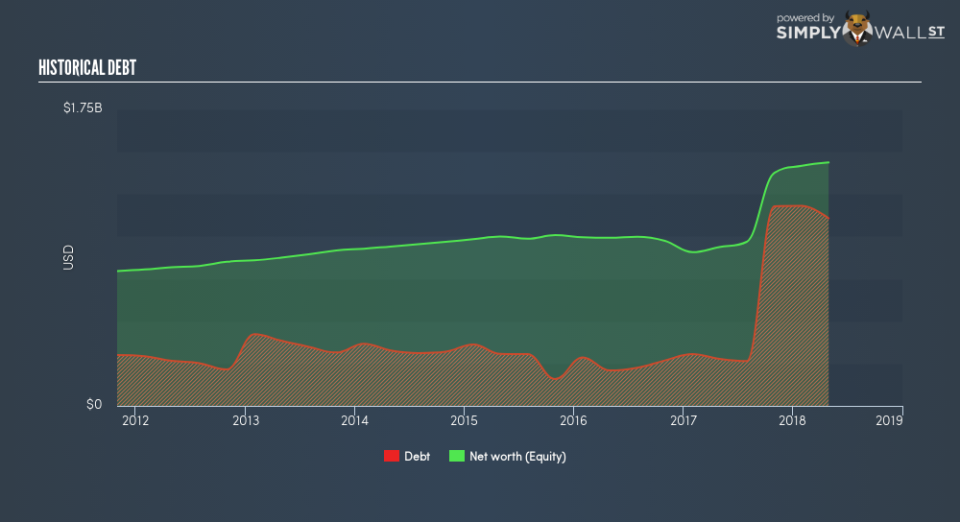
ABM’s debt levels surged from US$277.9m to US$1.11b over the last 12 months , which is made up of current and long term debt. With this growth in debt, ABM’s cash and short-term investments stands at US$69.7m for investing into the business. On top of this, ABM has produced cash from operations of US$90.8m during the same period of time, leading to an operating cash to total debt ratio of 8.2%, signalling that ABM’s debt is not appropriately covered by operating cash. This ratio can also be interpreted as a measure of efficiency as an alternative to return on assets. In ABM’s case, it is able to generate 0.082x cash from its debt capital.
Does ABM’s liquid assets cover its short-term commitments?
Looking at ABM’s most recent US$704.2m liabilities, the company has been able to meet these obligations given the level of current assets of US$1.22b, with a current ratio of 1.73x. Generally, for Commercial Services companies, this is a reasonable ratio since there is a bit of a cash buffer without leaving too much capital in a low-return environment.
Does ABM face the risk of succumbing to its debt-load?
With debt reaching 77.1% of equity, ABM may be thought of as relatively highly levered. This is not uncommon for a small-cap company given that debt tends to be lower-cost and at times, more accessible. We can check to see whether ABM is able to meet its debt obligations by looking at the net interest coverage ratio. A company generating earnings before interest and tax (EBIT) at least three times its net interest payments is considered financially sound. In ABM’s, case, the ratio of 3.6x suggests that interest is appropriately covered, which means that lenders may be less hesitant to lend out more funding as ABM’s high interest coverage is seen as responsible and safe practice.
Next Steps:
ABM’s cash flow coverage indicates it could improve its operating efficiency in order to meet demand for debt repayments should unforeseen events arise. However, the company exhibits proper management of current assets and upcoming liabilities. This is only a rough assessment of financial health, and I’m sure ABM has company-specific issues impacting its capital structure decisions. I recommend you continue to research ABM Industries to get a more holistic view of the stock by looking at:
Future Outlook: What are well-informed industry analysts predicting for ABM’s future growth? Take a look at our free research report of analyst consensus for ABM’s outlook.
Valuation: What is ABM worth today? Is the stock undervalued, even when its growth outlook is factored into its intrinsic value? The intrinsic value infographic in our free research report helps visualize whether ABM is currently mispriced by the market.
Other High-Performing Stocks: Are there other stocks that provide better prospects with proven track records? Explore our free list of these great stocks here.
To help readers see past the short term volatility of the financial market, we aim to bring you a long-term focused research analysis purely driven by fundamental data. Note that our analysis does not factor in the latest price-sensitive company announcements.
The author is an independent contributor and at the time of publication had no position in the stocks mentioned. For errors that warrant correction please contact the editor at editorial-team@simplywallst.com.
