
 Yahoo Finance
 ACNB (NASDAQ:ACNB) shareholders have endured a 5.9% loss from investing in the stock three years ago
For many investors, the main point of stock picking is to generate higher returns than the overall market. But the risk of stock picking is that you will likely buy under-performing companies. We regret to report that long term ACNB Corporation (NASDAQ:ACNB) shareholders have had that experience, with the share price dropping 15% in three years, versus a market return of about 45%.
So let's have a look and see if the longer term performance of the company has been in line with the underlying business' progress.
See our latest analysis for ACNB
To quote Buffett, 'Ships will sail around the world but the Flat Earth Society will flourish. There will continue to be wide discrepancies between price and value in the marketplace...' One flawed but reasonable way to assess how sentiment around a company has changed is to compare the earnings per share (EPS) with the share price.
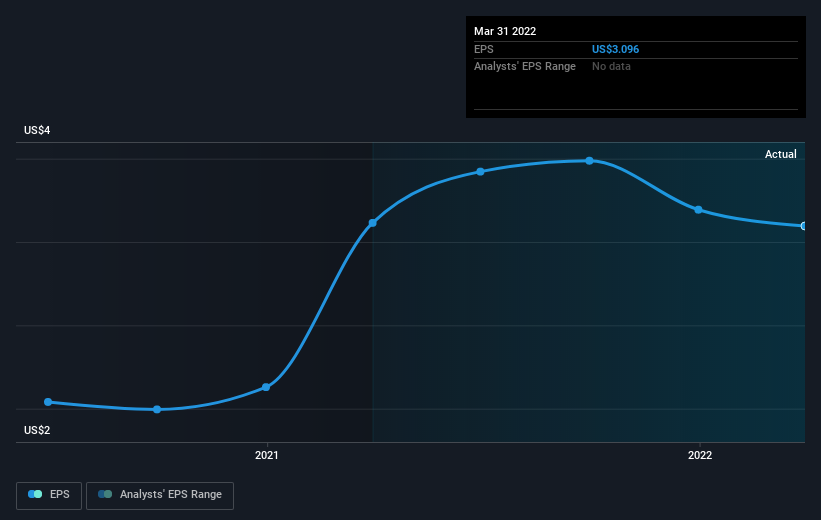
During the three years that the share price fell, ACNB's earnings per share (EPS) dropped by 1.3% each year. This reduction in EPS is slower than the 5% annual reduction in the share price. So it seems the market was too confident about the business, in the past. The less favorable sentiment is reflected in its current P/E ratio of 10.33.
The image below shows how EPS has tracked over time (if you click on the image you can see greater detail).
It's good to see that there was some significant insider buying in the last three months. That's a positive. That said, we think earnings and revenue growth trends are even more important factors to consider. This free interactive report on ACNB's earnings, revenue and cash flow is a great place to start, if you want to investigate the stock further.
What About Dividends?
When looking at investment returns, it is important to consider the difference between total shareholder return (TSR) and share price return. Whereas the share price return only reflects the change in the share price, the TSR includes the value of dividends (assuming they were reinvested) and the benefit of any discounted capital raising or spin-off. Arguably, the TSR gives a more comprehensive picture of the return generated by a stock. We note that for ACNB the TSR over the last 3 years was -5.9%, which is better than the share price return mentioned above. And there's no prize for guessing that the dividend payments largely explain the divergence!
A Different Perspective
It's nice to see that ACNB shareholders have received a total shareholder return of 18% over the last year. And that does include the dividend. That gain is better than the annual TSR over five years, which is 6%. Therefore it seems like sentiment around the company has been positive lately. Given the share price momentum remains strong, it might be worth taking a closer look at the stock, lest you miss an opportunity. It is all well and good that insiders have been buying shares, but we suggest you check here to see what price insiders were buying at.
ACNB is not the only stock insiders are buying. So take a peek at this free list of growing companies with insider buying.
Please note, the market returns quoted in this article reflect the market weighted average returns of stocks that currently trade on US exchanges.
Have feedback on this article? Concerned about the content? Get in touch with us directly. Alternatively, email editorial-team (at) simplywallst.com.
This article by Simply Wall St is general in nature. We provide commentary based on historical data and analyst forecasts only using an unbiased methodology and our articles are not intended to be financial advice. It does not constitute a recommendation to buy or sell any stock, and does not take account of your objectives, or your financial situation. We aim to bring you long-term focused analysis driven by fundamental data. Note that our analysis may not factor in the latest price-sensitive company announcements or qualitative material. Simply Wall St has no position in any stocks mentioned.
