
 Yahoo Finance
 Allied Farmers (NZSE:ALF) Might Be Having Difficulty Using Its Capital Effectively
If you're looking for a multi-bagger, there's a few things to keep an eye out for. One common approach is to try and find a company with returns on capital employed (ROCE) that are increasing, in conjunction with a growing amount of capital employed. This shows us that it's a compounding machine, able to continually reinvest its earnings back into the business and generate higher returns. Although, when we looked at Allied Farmers (NZSE:ALF), it didn't seem to tick all of these boxes.
What Is Return On Capital Employed (ROCE)?
If you haven't worked with ROCE before, it measures the 'return' (pre-tax profit) a company generates from capital employed in its business. Analysts use this formula to calculate it for Allied Farmers:
Return on Capital Employed = Earnings Before Interest and Tax (EBIT) ÷ (Total Assets - Current Liabilities)
0.19 = NZ$4.3m ÷ (NZ$35m - NZ$13m) (Based on the trailing twelve months to June 2023).
Therefore, Allied Farmers has an ROCE of 19%. That's a relatively normal return on capital, and it's around the 16% generated by the Food industry.
Check out our latest analysis for Allied Farmers
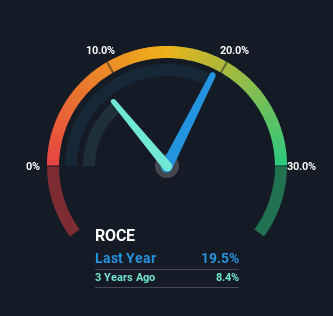
Historical performance is a great place to start when researching a stock so above you can see the gauge for Allied Farmers' ROCE against it's prior returns. If you'd like to look at how Allied Farmers has performed in the past in other metrics, you can view this free graph of past earnings, revenue and cash flow.
How Are Returns Trending?
When we looked at the ROCE trend at Allied Farmers, we didn't gain much confidence. Around five years ago the returns on capital were 44%, but since then they've fallen to 19%. However it looks like Allied Farmers might be reinvesting for long term growth because while capital employed has increased, the company's sales haven't changed much in the last 12 months. It may take some time before the company starts to see any change in earnings from these investments.
On a related note, Allied Farmers has decreased its current liabilities to 36% of total assets. That could partly explain why the ROCE has dropped. Effectively this means their suppliers or short-term creditors are funding less of the business, which reduces some elements of risk. Since the business is basically funding more of its operations with it's own money, you could argue this has made the business less efficient at generating ROCE.
The Bottom Line On Allied Farmers' ROCE
To conclude, we've found that Allied Farmers is reinvesting in the business, but returns have been falling. And investors may be recognizing these trends since the stock has only returned a total of 39% to shareholders over the last five years. Therefore, if you're looking for a multi-bagger, we'd propose looking at other options.
If you'd like to know about the risks facing Allied Farmers, we've discovered 1 warning sign that you should be aware of.
While Allied Farmers isn't earning the highest return, check out this free list of companies that are earning high returns on equity with solid balance sheets.
Have feedback on this article? Concerned about the content? Get in touch with us directly. Alternatively, email editorial-team (at) simplywallst.com.
This article by Simply Wall St is general in nature. We provide commentary based on historical data and analyst forecasts only using an unbiased methodology and our articles are not intended to be financial advice. It does not constitute a recommendation to buy or sell any stock, and does not take account of your objectives, or your financial situation. We aim to bring you long-term focused analysis driven by fundamental data. Note that our analysis may not factor in the latest price-sensitive company announcements or qualitative material. Simply Wall St has no position in any stocks mentioned.
