
 Yahoo Finance
 Is AMC Entertainment Holdings Inc’s (NYSE:AMC) Balance Sheet A Threat To Its Future?

While small-cap stocks, such as AMC Entertainment Holdings Inc (NYSE:AMC) with its market cap of US$2.00B, are popular for their explosive growth, investors should also be aware of their balance sheet to judge whether the company can survive a downturn. Since AMC is loss-making right now, it’s vital to understand the current state of its operations and pathway to profitability. I believe these basic checks tell most of the story you need to know. However, given that I have not delve into the company-specifics, I suggest you dig deeper yourself into AMC here.
Does AMC generate an acceptable amount of cash through operations?
Over the past year, AMC has ramped up its debt from US$4.44B to US$4.89B , which is made up of current and long term debt. With this rise in debt, AMC’s cash and short-term investments stands at US$310.00M for investing into the business. Additionally, AMC has produced US$558.70M in operating cash flow over the same time period, leading to an operating cash to total debt ratio of 11.43%, indicating that AMC’s current level of operating cash is not high enough to cover debt. This ratio can also be interpreted as a measure of efficiency for unprofitable businesses since metrics such as return on asset (ROA) requires a positive net income. In AMC’s case, it is able to generate 0.11x cash from its debt capital.
Can AMC pay its short-term liabilities?
Looking at AMC’s most recent US$1.41B liabilities, the company has not maintained a sufficient level of current assets to meet its obligations, with the current ratio last standing at 0.62x, which is below the prudent industry ratio of 3x.
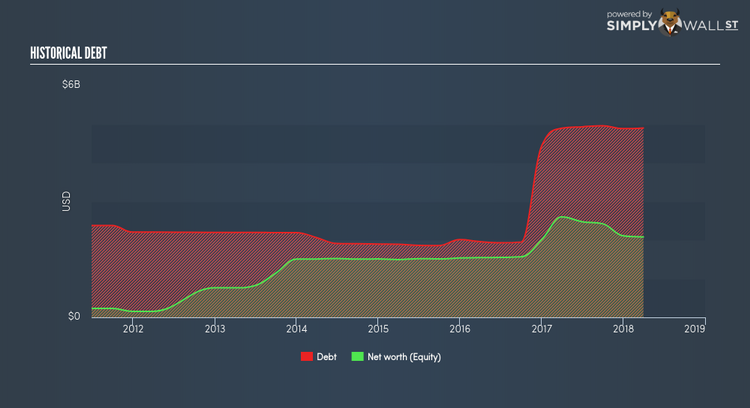
Can AMC service its debt comfortably?
With total debt exceeding equities, AMC is considered a highly levered company. This is not uncommon for a small-cap company given that debt tends to be lower-cost and at times, more accessible. Though, since AMC is presently loss-making, sustainability of its current state of operations becomes a concern. Maintaining a high level of debt, while revenues are still below costs, can be dangerous as liquidity tends to dry up in unexpected downturns.
Next Steps:
AMC’s high debt level indicates room for improvement. Furthermore, its cash flow coverage of less than a quarter of debt means that operating efficiency could also be an issue. In addition to this, its lack of liquidity raises questions over current asset management practices for the small-cap. Keep in mind I haven’t considered other factors such as how AMC has been performing in the past. I suggest you continue to research AMC Entertainment Holdings to get a more holistic view of the stock by looking at:
Future Outlook: What are well-informed industry analysts predicting for AMC’s future growth? Take a look at our free research report of analyst consensus for AMC’s outlook.
Valuation: What is AMC worth today? Is the stock undervalued, even when its growth outlook is factored into its intrinsic value? The intrinsic value infographic in our free research report helps visualize whether AMC is currently mispriced by the market.
Other High-Performing Stocks: Are there other stocks that provide better prospects with proven track records? Explore our free list of these great stocks here.
To help readers see pass the short term volatility of the financial market, we aim to bring you a long-term focused research analysis purely driven by fundamental data. Note that our analysis does not factor in the latest price sensitive company announcements.
The author is an independent contributor and at the time of publication had no position in the stocks mentioned.
