
 Yahoo Finance
 Amidst increasing losses, Investors bid up Skillz (NYSE:SKLZ) 5.8% this past week
Investing in stocks comes with the risk that the share price will fall. And unfortunately for Skillz Inc. (NYSE:SKLZ) shareholders, the stock is a lot lower today than it was a year ago. To wit the share price is down 54% in that time. Skillz hasn't been listed for long, so although we're wary of recent listings that perform poorly, it may still prove itself with time. More recently, the share price has dropped a further 26% in a month.
Although the past week has been more reassuring for shareholders, they're still in the red over the last year, so let's see if the underlying business has been responsible for the decline.
View our latest analysis for Skillz
Skillz wasn't profitable in the last twelve months, it is unlikely we'll see a strong correlation between its share price and its earnings per share (EPS). Arguably revenue is our next best option. When a company doesn't make profits, we'd generally expect to see good revenue growth. As you can imagine, fast revenue growth, when maintained, often leads to fast profit growth.
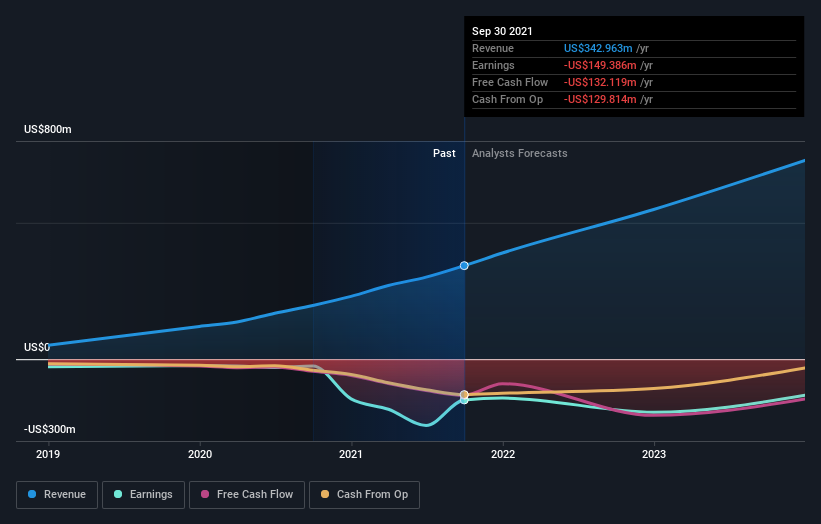
In the last twelve months, Skillz increased its revenue by 74%. That's well above most other pre-profit companies. Meanwhile, the share price slid 54%. Typically a growth stock like this will be volatile, with some shareholders concerned about the red ink on the bottom line (that is, the losses). We'd definitely consider it a positive if the company is trending towards profitability. If you can see that happening, then perhaps consider adding this stock to your watchlist.
The image below shows how earnings and revenue have tracked over time (if you click on the image you can see greater detail).
It's probably worth noting we've seen significant insider buying in the last quarter, which we consider a positive. That said, we think earnings and revenue growth trends are even more important factors to consider. So we recommend checking out this free report showing consensus forecasts
A Different Perspective
While Skillz shareholders are down 54% for the year, the market itself is up 22%. While the aim is to do better than that, it's worth recalling that even great long-term investments sometimes underperform for a year or more. With the stock down 19% over the last three months, the market doesn't seem to believe that the company has solved all its problems. Basically, most investors should be wary of buying into a poor-performing stock, unless the business itself has clearly improved. It's always interesting to track share price performance over the longer term. But to understand Skillz better, we need to consider many other factors. Take risks, for example - Skillz has 3 warning signs (and 1 which is significant) we think you should know about.
If you like to buy stocks alongside management, then you might just love this free list of companies. (Hint: insiders have been buying them).
Please note, the market returns quoted in this article reflect the market weighted average returns of stocks that currently trade on US exchanges.
Have feedback on this article? Concerned about the content? Get in touch with us directly. Alternatively, email editorial-team (at) simplywallst.com.
This article by Simply Wall St is general in nature. We provide commentary based on historical data and analyst forecasts only using an unbiased methodology and our articles are not intended to be financial advice. It does not constitute a recommendation to buy or sell any stock, and does not take account of your objectives, or your financial situation. We aim to bring you long-term focused analysis driven by fundamental data. Note that our analysis may not factor in the latest price-sensitive company announcements or qualitative material. Simply Wall St has no position in any stocks mentioned.
