
 Yahoo Finance
 Apollo Medical Holdings (NASDAQ:AMEH) Is Experiencing Growth In Returns On Capital
If we want to find a potential multi-bagger, often there are underlying trends that can provide clues. Firstly, we'll want to see a proven return on capital employed (ROCE) that is increasing, and secondly, an expanding base of capital employed. Basically this means that a company has profitable initiatives that it can continue to reinvest in, which is a trait of a compounding machine. So on that note, Apollo Medical Holdings (NASDAQ:AMEH) looks quite promising in regards to its trends of return on capital.
Return On Capital Employed (ROCE): What is it?
For those that aren't sure what ROCE is, it measures the amount of pre-tax profits a company can generate from the capital employed in its business. To calculate this metric for Apollo Medical Holdings, this is the formula:
Return on Capital Employed = Earnings Before Interest and Tax (EBIT) ÷ (Total Assets - Current Liabilities)
0.14 = US$105m ÷ (US$912m - US$160m) (Based on the trailing twelve months to March 2022).
So, Apollo Medical Holdings has an ROCE of 14%. On its own, that's a standard return, however it's much better than the 10% generated by the Healthcare industry.
See our latest analysis for Apollo Medical Holdings
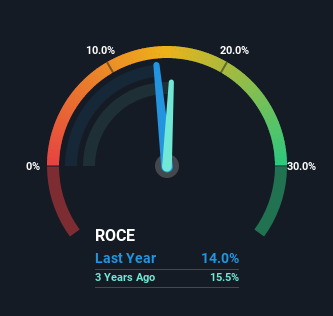
Historical performance is a great place to start when researching a stock so above you can see the gauge for Apollo Medical Holdings' ROCE against it's prior returns. If you'd like to look at how Apollo Medical Holdings has performed in the past in other metrics, you can view this free graph of past earnings, revenue and cash flow.
What The Trend Of ROCE Can Tell Us
We like the trends that we're seeing from Apollo Medical Holdings. Over the last five years, returns on capital employed have risen substantially to 14%. The amount of capital employed has increased too, by 146%. This can indicate that there's plenty of opportunities to invest capital internally and at ever higher rates, a combination that's common among multi-baggers.
The Bottom Line On Apollo Medical Holdings' ROCE
All in all, it's terrific to see that Apollo Medical Holdings is reaping the rewards from prior investments and is growing its capital base. And with the stock having performed exceptionally well over the last three years, these patterns are being accounted for by investors. In light of that, we think it's worth looking further into this stock because if Apollo Medical Holdings can keep these trends up, it could have a bright future ahead.
One more thing to note, we've identified 4 warning signs with Apollo Medical Holdings and understanding them should be part of your investment process.
While Apollo Medical Holdings may not currently earn the highest returns, we've compiled a list of companies that currently earn more than 25% return on equity. Check out this free list here.
Have feedback on this article? Concerned about the content? Get in touch with us directly. Alternatively, email editorial-team (at) simplywallst.com.
This article by Simply Wall St is general in nature. We provide commentary based on historical data and analyst forecasts only using an unbiased methodology and our articles are not intended to be financial advice. It does not constitute a recommendation to buy or sell any stock, and does not take account of your objectives, or your financial situation. We aim to bring you long-term focused analysis driven by fundamental data. Note that our analysis may not factor in the latest price-sensitive company announcements or qualitative material. Simply Wall St has no position in any stocks mentioned.
