
 Yahoo Finance
 Argosy Property (NZSE:ARG) shareholders have endured a 7.3% loss from investing in the stock three years ago
No-one enjoys it when they lose money on a stock. But it's hard to avoid some disappointing investments when the overall market is down. While the Argosy Property Limited (NZSE:ARG) share price is down 20% in the last three years, the total return to shareholders (which includes dividends) was -7.3%. That's better than the market which declined 7.9% over the last three years.
So let's have a look and see if the longer term performance of the company has been in line with the underlying business' progress.
View our latest analysis for Argosy Property
There is no denying that markets are sometimes efficient, but prices do not always reflect underlying business performance. By comparing earnings per share (EPS) and share price changes over time, we can get a feel for how investor attitudes to a company have morphed over time.
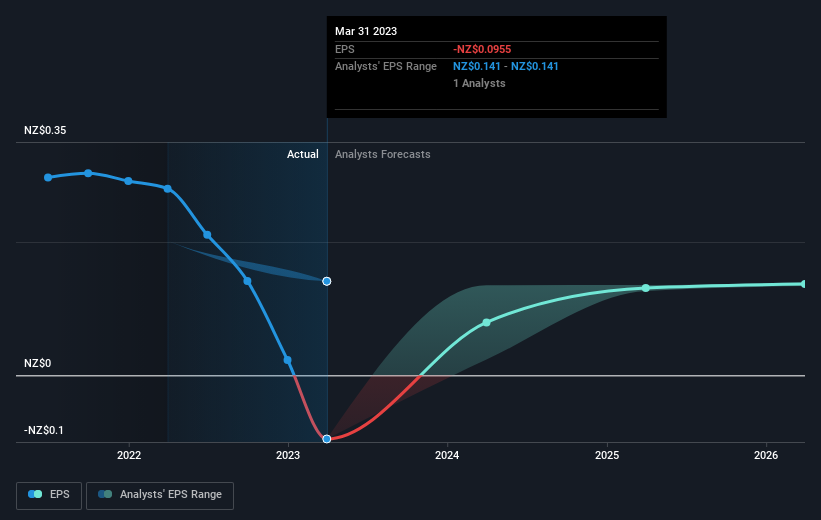
Argosy Property saw its share price decline over the three years in which its EPS also dropped, falling to a loss. This was, in part, due to extraordinary items impacting earnings. Due to the loss, it's not easy to use EPS as a reliable guide to the business. However, we can say we'd expect to see a falling share price in this scenario.
You can see how EPS has changed over time in the image below (click on the chart to see the exact values).
This free interactive report on Argosy Property's earnings, revenue and cash flow is a great place to start, if you want to investigate the stock further.
What About Dividends?
It is important to consider the total shareholder return, as well as the share price return, for any given stock. The TSR incorporates the value of any spin-offs or discounted capital raisings, along with any dividends, based on the assumption that the dividends are reinvested. It's fair to say that the TSR gives a more complete picture for stocks that pay a dividend. In the case of Argosy Property, it has a TSR of -7.3% for the last 3 years. That exceeds its share price return that we previously mentioned. And there's no prize for guessing that the dividend payments largely explain the divergence!
A Different Perspective
Argosy Property shareholders are up 3.9% for the year (even including dividends). But that return falls short of the market. It's probably a good sign that the company has an even better long term track record, having provided shareholders with an annual TSR of 6% over five years. Maybe the share price is just taking a breather while the business executes on its growth strategy. While it is well worth considering the different impacts that market conditions can have on the share price, there are other factors that are even more important. Even so, be aware that Argosy Property is showing 1 warning sign in our investment analysis , you should know about...
Of course, you might find a fantastic investment by looking elsewhere. So take a peek at this free list of companies we expect will grow earnings.
Please note, the market returns quoted in this article reflect the market weighted average returns of stocks that currently trade on New Zealander exchanges.
Have feedback on this article? Concerned about the content? Get in touch with us directly. Alternatively, email editorial-team (at) simplywallst.com.
This article by Simply Wall St is general in nature. We provide commentary based on historical data and analyst forecasts only using an unbiased methodology and our articles are not intended to be financial advice. It does not constitute a recommendation to buy or sell any stock, and does not take account of your objectives, or your financial situation. We aim to bring you long-term focused analysis driven by fundamental data. Note that our analysis may not factor in the latest price-sensitive company announcements or qualitative material. Simply Wall St has no position in any stocks mentioned.
