
 Yahoo Finance
 Is Armstrong World Industries Inc (NYSE:AWI) A Financially Sound Company?

Small-caps and large-caps are wildly popular among investors, however, mid-cap stocks, such as Armstrong World Industries Inc (NYSE:AWI), with a market capitalization of US$3.28b, rarely draw their attention from the investing community. Despite this, commonly overlooked mid-caps have historically produced better risk-adjusted returns than their small and large-cap counterparts. Today we will look at AWI’s financial liquidity and debt levels, which are strong indicators for whether the company can weather economic downturns or fund strategic acquisitions for future growth. Note that this information is centred entirely on financial health and is a top-level understanding, so I encourage you to look further into AWI here. View out our latest analysis for Armstrong World Industries
How much cash does AWI generate through its operations?
Over the past year, AWI has maintained its debt levels at around US$850.20m comprising of short- and long-term debt. At this constant level of debt, AWI currently has US$159.80m remaining in cash and short-term investments , ready to deploy into the business. On top of this, AWI has produced US$170.40m in operating cash flow in the last twelve months, leading to an operating cash to total debt ratio of 20.04%, meaning that AWI’s current level of operating cash is high enough to cover debt. This ratio can also be interpreted as a measure of efficiency as an alternative to return on assets. In AWI’s case, it is able to generate 0.2x cash from its debt capital.
Does AWI’s liquid assets cover its short-term commitments?
At the current liabilities level of US$269.90m liabilities, it appears that the company has been able to meet these commitments with a current assets level of US$648.90m, leading to a 2.4x current account ratio. Generally, for Building companies, this is a reasonable ratio since there is a bit of a cash buffer without leaving too much capital in a low-return environment.
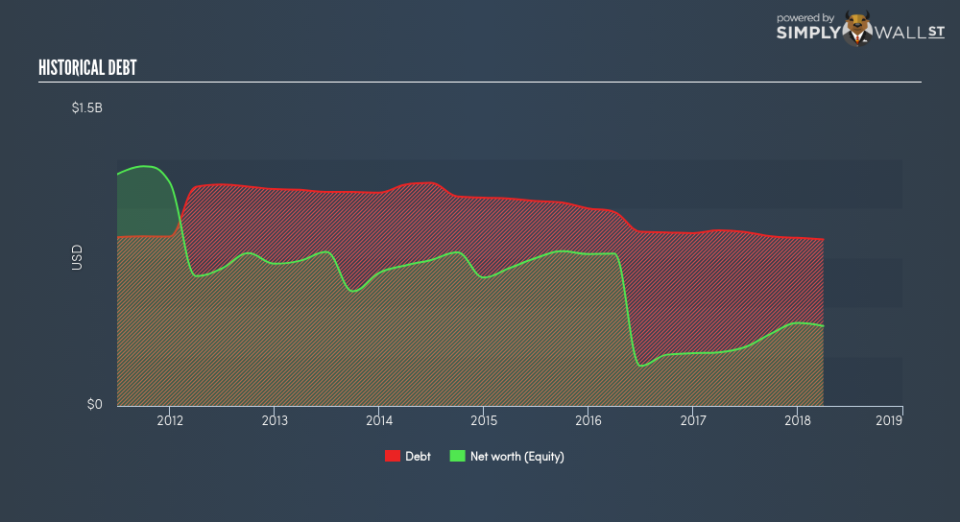
Does AWI face the risk of succumbing to its debt-load?
Since total debt levels have outpaced equities, AWI is a highly leveraged company. This is not unusual for mid-caps as debt tends to be a cheaper and faster source of funding for some businesses. We can check to see whether AWI is able to meet its debt obligations by looking at the net interest coverage ratio. A company generating earnings before interest and tax (EBIT) at least three times its net interest payments is considered financially sound. In AWI’s, case, the ratio of 5.61x suggests that interest is appropriately covered, which means that debtors may be willing to loan the company more money, giving AWI ample headroom to grow its debt facilities.
Next Steps:
AWI’s debt and cash flow levels indicate room for improvement. Its cash flow coverage of less than a quarter of debt means that operating efficiency could be an issue. However, the company will be able to pay all of its upcoming liabilities from its current short-term assets. Keep in mind I haven’t considered other factors such as how AWI has been performing in the past. You should continue to research Armstrong World Industries to get a more holistic view of the stock by looking at:
Future Outlook: What are well-informed industry analysts predicting for AWI’s future growth? Take a look at our free research report of analyst consensus for AWI’s outlook.
Valuation: What is AWI worth today? Is the stock undervalued, even when its growth outlook is factored into its intrinsic value? The intrinsic value infographic in our free research report helps visualize whether AWI is currently mispriced by the market.
Other High-Performing Stocks: Are there other stocks that provide better prospects with proven track records? Explore our free list of these great stocks here.
To help readers see pass the short term volatility of the financial market, we aim to bring you a long-term focused research analysis purely driven by fundamental data. Note that our analysis does not factor in the latest price sensitive company announcements.
The author is an independent contributor and at the time of publication had no position in the stocks mentioned.
