
 Yahoo Finance
 Are Arvida Group Limited’s (NZSE:ARV) High Returns Really That Great?

Want to participate in a short research study? Help shape the future of investing tools and you could win a $250 gift card!
Today we are going to look at Arvida Group Limited (NZSE:ARV) to see whether it might be an attractive investment prospect. In particular, we'll consider its Return On Capital Employed (ROCE), as that can give us insight into how profitably the company is able to employ capital in its business.
First, we'll go over how we calculate ROCE. Second, we'll look at its ROCE compared to similar companies. Last but not least, we'll look at what impact its current liabilities have on its ROCE.
Understanding Return On Capital Employed (ROCE)
ROCE measures the 'return' (pre-tax profit) a company generates from capital employed in its business. All else being equal, a better business will have a higher ROCE. In brief, it is a useful tool, but it is not without drawbacks. Renowned investment researcher Michael Mauboussin has suggested that a high ROCE can indicate that 'one dollar invested in the company generates value of more than one dollar'.
How Do You Calculate Return On Capital Employed?
The formula for calculating the return on capital employed is:
Return on Capital Employed = Earnings Before Interest and Tax (EBIT) ÷ (Total Assets - Current Liabilities)
Or for Arvida Group:
0.014 = NZ$18m ÷ (NZ$1.3b - NZ$85m) (Based on the trailing twelve months to March 2019.)
So, Arvida Group has an ROCE of 1.4%.
See our latest analysis for Arvida Group
Is Arvida Group's ROCE Good?
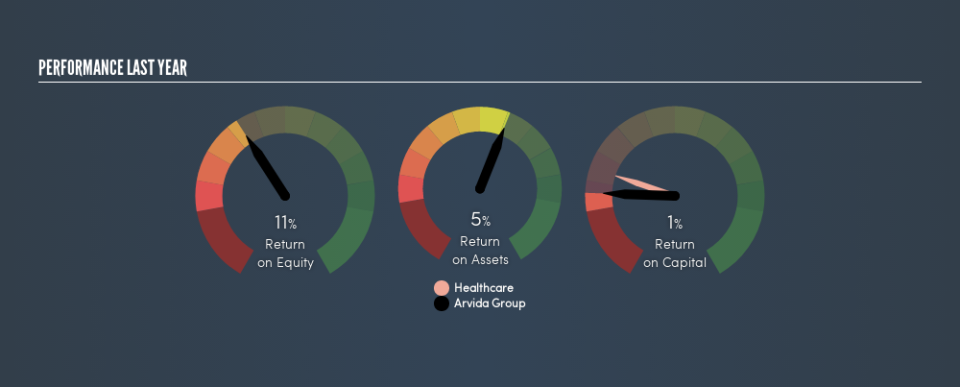
ROCE is commonly used for comparing the performance of similar businesses. In our analysis, Arvida Group's ROCE is meaningfully higher than the 0.9% average in the Healthcare industry. We consider this a positive sign, because it suggests it uses capital more efficiently than similar companies. Independently of how Arvida Group compares to its industry, its ROCE in absolute terms is low; especially compared to the ~2.4% available in government bonds. Readers may wish to look for more rewarding investments.
Arvida Group's current ROCE of 1.4% is lower than its ROCE in the past, which was 3.4%, 3 years ago. So investors might consider if it has had issues recently. You can click on the image below to see (in greater detail) how Arvida Group's past growth compares to other companies.
It is important to remember that ROCE shows past performance, and is not necessarily predictive. ROCE can be misleading for companies in cyclical industries, with returns looking impressive during the boom times, but very weak during the busts. This is because ROCE only looks at one year, instead of considering returns across a whole cycle. Future performance is what matters, and you can see analyst predictions in our free report on analyst forecasts for the company.
Do Arvida Group's Current Liabilities Skew Its ROCE?
Short term (or current) liabilities, are things like supplier invoices, overdrafts, or tax bills that need to be paid within 12 months. The ROCE equation subtracts current liabilities from capital employed, so a company with a lot of current liabilities appears to have less capital employed, and a higher ROCE than otherwise. To counter this, investors can check if a company has high current liabilities relative to total assets.
Arvida Group has total liabilities of NZ$85m and total assets of NZ$1.3b. Therefore its current liabilities are equivalent to approximately 6.5% of its total assets. Arvida Group has a low level of current liabilities, which have a negligible impact on its already low ROCE.
Our Take On Arvida Group's ROCE
Nevertheless, there are potentially more attractive companies to invest in. Of course, you might find a fantastic investment by looking at a few good candidates. So take a peek at this free list of companies with modest (or no) debt, trading on a P/E below 20.
If you like to buy stocks alongside management, then you might just love this free list of companies. (Hint: insiders have been buying them).
We aim to bring you long-term focused research analysis driven by fundamental data. Note that our analysis may not factor in the latest price-sensitive company announcements or qualitative material.
If you spot an error that warrants correction, please contact the editor at editorial-team@simplywallst.com. This article by Simply Wall St is general in nature. It does not constitute a recommendation to buy or sell any stock, and does not take account of your objectives, or your financial situation. Simply Wall St has no position in the stocks mentioned. Thank you for reading.
