
 Yahoo Finance
 Banco De Chile's Dividend Analysis
Exploring the Sustainability of Banco De Chile's Dividend
Banco De Chile (NYSE:BCH) recently announced a dividend of $1.69 per share, payable on 2024-04-05, with the ex-dividend date set for 2024-03-21. As investors look forward to this upcoming payment, the spotlight also shines on the company's dividend history, yield, and growth rates. Using the data from GuruFocus, let's delve into Banco De Chile's dividend performance and assess its sustainability.
What Does Banco De Chile Do?
This Powerful Chart Made Peter Lynch 29% A Year For 13 Years
How to calculate the intrinsic value of a stock?
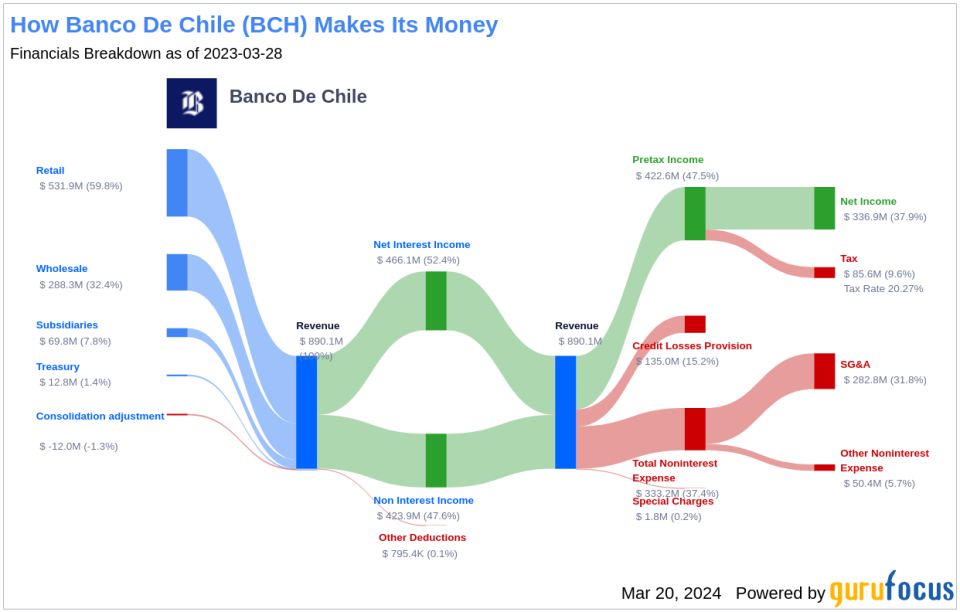
Operating under three separate brand names (Banco de Chile, Banco Edwards-Citi, and Banco CrediChile), Banco de Chile is the second largest in the country by loans and third largest by deposits. Banco de Chile generates most of its net interest income (roughly 60% of total revenue) from its mortgage, unsecured consumer credit lines, and commercial loans, with 25% of its outstanding loans being made to firms with more than 10,000 million CLP in revenue. Outside of its banking business, Banco de Chile is the largest asset manager in the country and one of the largest security brokerages, supporting its substantial fee-based revenue.
A Glimpse at Banco De Chile's Dividend History
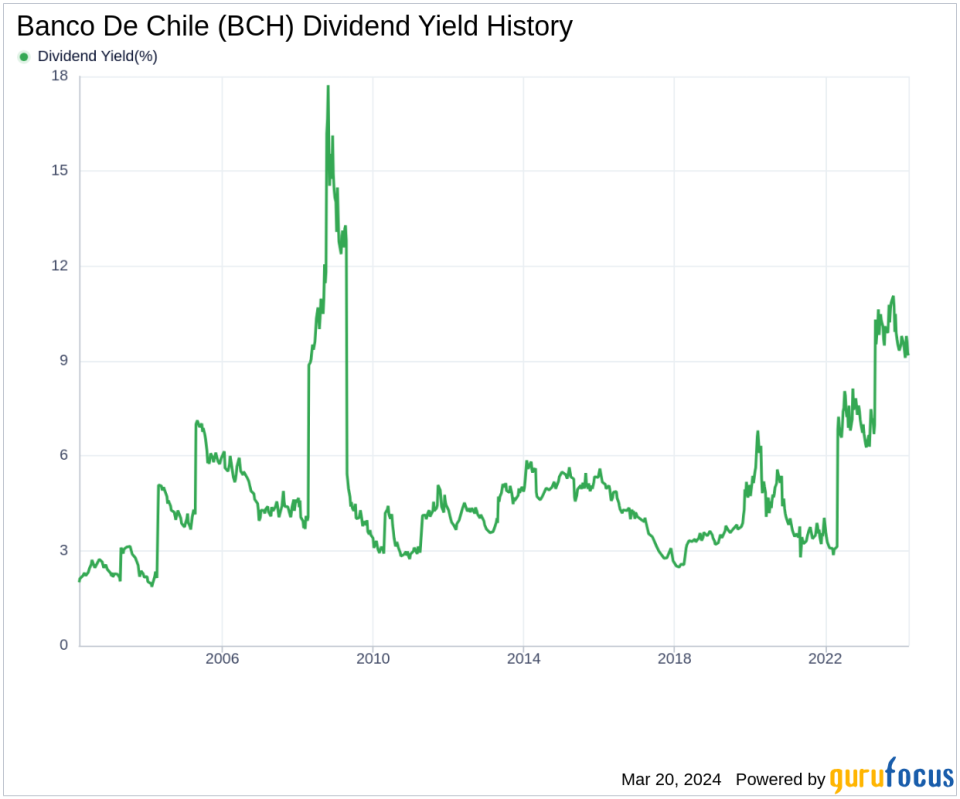
Banco De Chile has maintained a consistent dividend payment record since 2002, with dividends currently distributed on a yearly basis. Below is a chart showing annual Dividends Per Share for tracking historical trends.
Breaking Down Banco De Chile's Dividend Yield and Growth
As of today, Banco De Chile currently has a 12-month trailing dividend yield of 9.41% and a 12-month forward dividend yield of 7.43%, suggesting an expectation of decreased dividend payments over the next 12 months.
Over the past three years, Banco De Chile's annual dividend growth rate was 35.20%. Extended to a five-year horizon, this rate decreased to 18.40% per year. And over the past decade, Banco De Chile's annual dividends per share growth rate stands at 6.70%.
Based on Banco De Chile's dividend yield and five-year growth rate, the 5-year yield on cost of Banco De Chile stock as of today is approximately 21.90%.
The Sustainability Question: Payout Ratio and Profitability
To assess the sustainability of the dividend, one needs to evaluate the company's payout ratio. The dividend payout ratio provides insights into the portion of earnings the company distributes as dividends. A lower ratio suggests that the company retains a significant part of its earnings, thereby ensuring the availability of funds for future growth and unexpected downturns. As of 2023-12-31, Banco De Chile's dividend payout ratio is 0.73, which may suggest that the company's dividend may not be sustainable.
Banco De Chile's profitability rank, offers an understanding of the company's earnings prowess relative to its peers. GuruFocus ranks Banco De Chile's profitability 6 out of 10 as of 2023-12-31, suggesting fair profitability. The company has reported positive net income for each year over the past decade, further solidifying its high profitability.
Growth Metrics: The Future Outlook
To ensure the sustainability of dividends, a company must have robust growth metrics. Banco De Chile's growth rank of 6 out of 10 suggests that the company has a fair growth outlook.
Revenue is the lifeblood of any company, and Banco De Chile's revenue per share, combined with the 3-year revenue growth rate, indicates a strong revenue model. Banco De Chile's revenue has increased by approximately 15.40% per year on average, a rate that outperforms approximately 80.53% of global competitors.
The company's 3-year EPS growth rate showcases its capability to grow its earnings, a critical component for sustaining dividends in the long run. During the past three years, Banco De Chile's earnings increased by approximately 45.70% per year on average, a rate that outperforms approximately 89.81% of global competitors.
Lastly, the company's 5-year EBITDA growth rate of 23.00%, which outperforms approximately 86.38% of global competitors.
Concluding Thoughts on Banco De Chile's Dividend Profile
In conclusion, Banco De Chile's dividend payments, growth rate, payout ratio, and profitability present a mixed picture for investors. While the company's strong revenue and earnings growth bode well for future dividend sustainability, the current payout ratio may raise concerns. Investors should consider these factors in the context of their individual investment strategies and monitor the company's performance closely. With the right balance of caution and optimism, Banco De Chile may continue to be a valuable addition to a dividend-focused portfolio.
GuruFocus Premium users can screen for high-dividend yield stocks using the High Dividend Yield Screener.
This article, generated by GuruFocus, is designed to provide general insights and is not tailored financial advice. Our commentary is rooted in historical data and analyst projections, utilizing an impartial methodology, and is not intended to serve as specific investment guidance. It does not formulate a recommendation to purchase or divest any stock and does not consider individual investment objectives or financial circumstances. Our objective is to deliver long-term, fundamental data-driven analysis. Be aware that our analysis might not incorporate the most recent, price-sensitive company announcements or qualitative information. GuruFocus holds no position in the stocks mentioned herein.
This article first appeared on GuruFocus.
