
 Yahoo Finance
 Basf SE's Dividend Analysis
Assessing the Upcoming Dividend, Historical Payouts, and Financial Health of Basf SE (BASFY)
Basf SE(BASFY) recently announced a dividend of $0.92 per share, payable on 2024-05-10, with the ex-dividend date set for 2024-04-26. As investors look forward to this upcoming payment, the spotlight also shines on the company's dividend history, yield, and growth rates. Using the data from GuruFocus, let's look into Basf SE's dividend performance and assess its sustainability.
What Does Basf SE Do?
Warning! GuruFocus has detected 10 Warning Signs with BASFY.
This Powerful Chart Made Peter Lynch 29% A Year For 13 Years
How to calculate the intrinsic value of a stock?
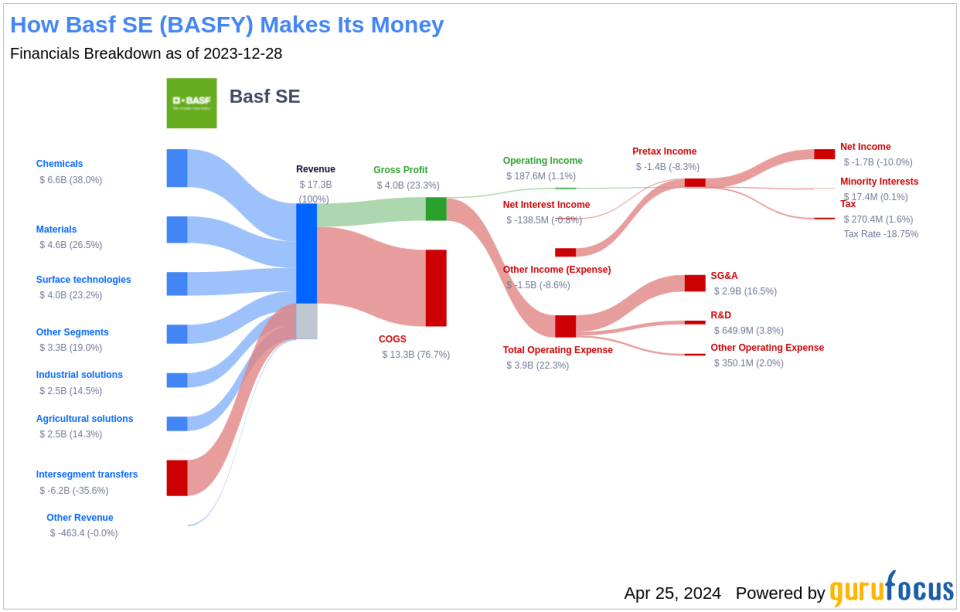
Founded in 1865 and based in Germany, Basf SE is the world's largest chemical company, with products spanning the full spectrum of commodities to specialties. In addition, the company is a strong player in agricultural crop protection chemicals and emissions control catalysts for cars and trucks. Given its sheer size, Basf SE has a top-three market position in approximately 70% of its businesses.
A Glimpse at Basf SE's Dividend History
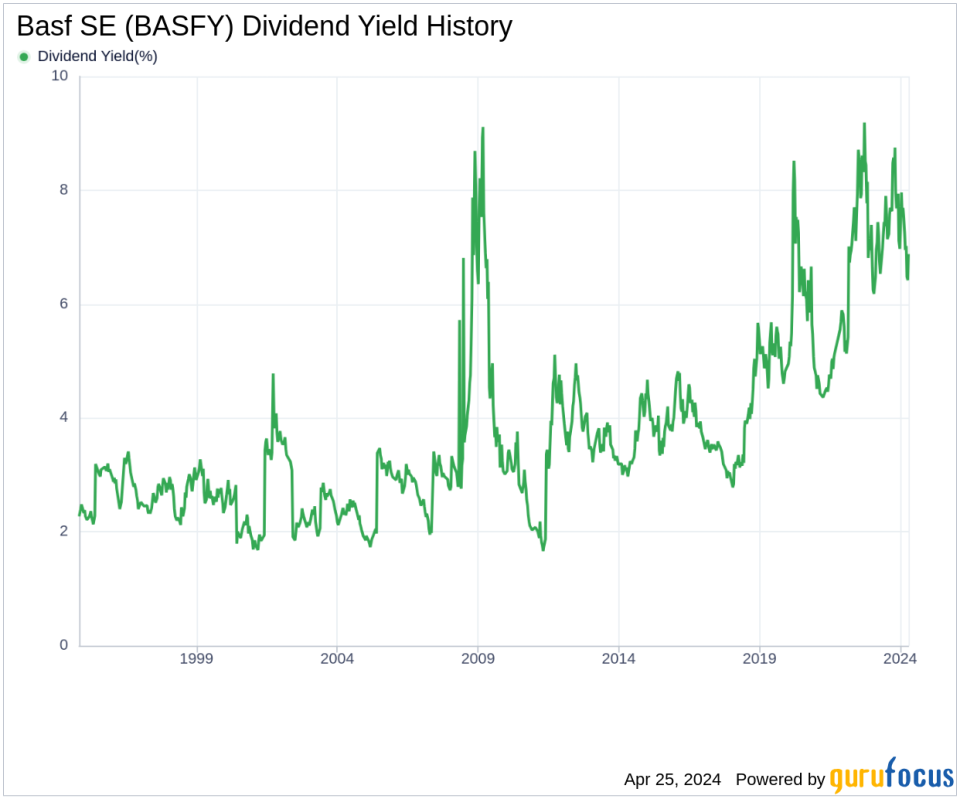
Basf SE has maintained a consistent dividend payment record since 1989. Dividends are currently distributed on a yearly basis. Below is a chart showing annual Dividends Per Share for tracking historical trends.
Breaking Down Basf SE's Dividend Yield and Growth
As of today, Basf SE currently has a 12-month trailing dividend yield of 6.82% and a 12-month forward dividend yield of 6.75%. This suggests an expectation of decreased dividend payments over the next 12 months.
Over the past three years, Basf SE's annual dividend growth rate was 1.00%. Extended to a five-year horizon, this rate increased to 1.90% per year. And over the past decade, Basf SE's annual dividends per share growth rate stands at 2.80%.
Based on Basf SE's dividend yield and five-year growth rate, the 5-year yield on cost of Basf SE stock as of today is approximately 7.49%.
The Sustainability Question: Payout Ratio and Profitability
To assess the sustainability of the dividend, one needs to evaluate the company's payout ratio. The dividend payout ratio provides insights into the portion of earnings the company distributes as dividends. A lower ratio suggests that the company retains a significant part of its earnings, thereby ensuring the availability of funds for future growth and unexpected downturns. As of 2023-12-31, Basf SE's dividend payout ratio is 15.18, which may suggest that the company's dividend could be sustainable.
Basf SE's profitability rank, offers an understanding of the company's earnings prowess relative to its peers. GuruFocus ranks Basf SE's profitability 7 out of 10 as of 2023-12-31, suggesting good profitability prospects. The company has reported net profit in 8 years out of the past 10 years.
Growth Metrics: The Future Outlook
To ensure the sustainability of dividends, a company must have robust growth metrics. Basf SE's growth rank of 7 out of 10 suggests that the company's growth trajectory is good relative to its competitors.
Revenue is the lifeblood of any company, and Basf SE's revenue per share, combined with the 3-year revenue growth rate, indicates a strong revenue model. Basf SE's revenue has increased by approximately 6.20% per year on average, a rate that underperforms approximately 59.56% of global competitors.
Next Steps
In conclusion, Basf SE's dividend payments, dividend growth rate, payout ratio, profitability, and growth metrics paint a picture of a company with a strong dividend history and reasonable expectations for sustainability. However, the slight expected decrease in dividend payments and the underperformance in revenue growth relative to global competitors warrant close monitoring by investors. Value investors should consider these factors in the context of their investment strategy and the overall performance of the chemical industry. Will Basf SE continue to provide a stable dividend yield, and what role will market conditions play in its future payouts?
GuruFocus Premium users can screen for high-dividend yield stocks using the High Dividend Yield Screener.
This article, generated by GuruFocus, is designed to provide general insights and is not tailored financial advice. Our commentary is rooted in historical data and analyst projections, utilizing an impartial methodology, and is not intended to serve as specific investment guidance. It does not formulate a recommendation to purchase or divest any stock and does not consider individual investment objectives or financial circumstances. Our objective is to deliver long-term, fundamental data-driven analysis. Be aware that our analysis might not incorporate the most recent, price-sensitive company announcements or qualitative information. GuruFocus holds no position in the stocks mentioned herein.
This article first appeared on GuruFocus.
