
 Yahoo Finance
 Benign Growth For Sonoma Pharmaceuticals, Inc. (NASDAQ:SNOA) Underpins Its Share Price
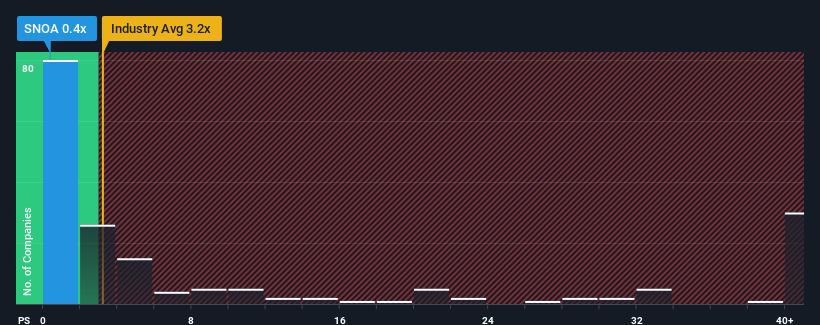
Sonoma Pharmaceuticals, Inc.'s (NASDAQ:SNOA) price-to-sales (or "P/S") ratio of 0.4x might make it look like a strong buy right now compared to the Pharmaceuticals industry in the United States, where around half of the companies have P/S ratios above 3.2x and even P/S above 18x are quite common. Although, it's not wise to just take the P/S at face value as there may be an explanation why it's so limited.
Check out our latest analysis for Sonoma Pharmaceuticals
How Sonoma Pharmaceuticals Has Been Performing
For example, consider that Sonoma Pharmaceuticals' financial performance has been pretty ordinary lately as revenue growth is non-existent. Perhaps the market believes the recent lacklustre revenue performance is a sign of future underperformance relative to industry peers, hurting the P/S. If you like the company, you'd be hoping this isn't the case so that you could potentially pick up some stock while it's out of favour.
Want the full picture on earnings, revenue and cash flow for the company? Then our free report on Sonoma Pharmaceuticals will help you shine a light on its historical performance.
What Are Revenue Growth Metrics Telling Us About The Low P/S?
The only time you'd be truly comfortable seeing a P/S as depressed as Sonoma Pharmaceuticals' is when the company's growth is on track to lag the industry decidedly.
Taking a look back first, we see that there was hardly any revenue growth to speak of for the company over the past year. This isn't what shareholders were looking for as it means they've been left with a 30% decline in revenue over the last three years in total. Accordingly, shareholders would have felt downbeat about the medium-term rates of revenue growth.
In contrast to the company, the rest of the industry is expected to grow by 5.8% over the next year, which really puts the company's recent medium-term revenue decline into perspective.
With this in mind, we understand why Sonoma Pharmaceuticals' P/S is lower than most of its industry peers. Nonetheless, there's no guarantee the P/S has reached a floor yet with revenue going in reverse. There's potential for the P/S to fall to even lower levels if the company doesn't improve its top-line growth.
What We Can Learn From Sonoma Pharmaceuticals' P/S?
Typically, we'd caution against reading too much into price-to-sales ratios when settling on investment decisions, though it can reveal plenty about what other market participants think about the company.
Our examination of Sonoma Pharmaceuticals confirms that the company's shrinking revenue over the past medium-term is a key factor in its low price-to-sales ratio, given the industry is projected to grow. At this stage investors feel the potential for an improvement in revenue isn't great enough to justify a higher P/S ratio. Given the current circumstances, it seems unlikely that the share price will experience any significant movement in either direction in the near future if recent medium-term revenue trends persist.
Before you take the next step, you should know about the 4 warning signs for Sonoma Pharmaceuticals that we have uncovered.
It's important to make sure you look for a great company, not just the first idea you come across. So if growing profitability aligns with your idea of a great company, take a peek at this free list of interesting companies with strong recent earnings growth (and a low P/E).
Have feedback on this article? Concerned about the content? Get in touch with us directly. Alternatively, email editorial-team (at) simplywallst.com.
This article by Simply Wall St is general in nature. We provide commentary based on historical data and analyst forecasts only using an unbiased methodology and our articles are not intended to be financial advice. It does not constitute a recommendation to buy or sell any stock, and does not take account of your objectives, or your financial situation. We aim to bring you long-term focused analysis driven by fundamental data. Note that our analysis may not factor in the latest price-sensitive company announcements or qualitative material. Simply Wall St has no position in any stocks mentioned.
Join A Paid User Research Session
You’ll receive a US$30 Amazon Gift card for 1 hour of your time while helping us build better investing tools for the individual investors like yourself. Sign up here
