
 Yahoo Finance
 Will Bitcoin Fall Further?
Everybody who has been following and trading Bitcoin recently, are likely to be disappointed. For eight months now, since February 2018, the price of Bitcoin hasn’t budged. The cryptocurrency’s last move in February saw it drop to a low point of 6,000 USD and, since then, there has been decreasing volatility and lower highs, while the lows remain at the same point. These factors are typical of a bearish trend. It is also interesting to add that the Bitcoin daily chart resembles a very big descending triangle pattern, which is a bearish formation.
Also, the king of cryptos has already lost around 70% of its value since its December peak, while other, smaller coins – known as Altcoins – have lost more than 70% of their value. Therefore, this huge decline is on a larger scale than what occurred in 2000, when the dotcom bubble burst.
Meanwhile, the market cap of Bitcoin has decreased from 330 billion USD to the current market cap of 115 billion USD, while the entire market capitalization of the crypto world, has dropped from 813 billion USD to around 225 billion USD recently. We may see a further drop.
The volatility of Bitcoin has been minimal over the past couple of days and weeks which suggests we may be in either an accumulation or distribution phase – which means a huge move might be around the corner.
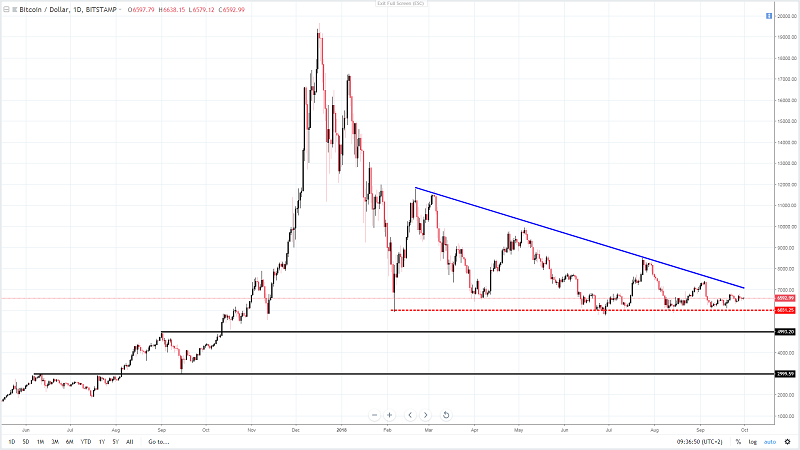
Should Bitcoin drop further below the support of 6,000 USD, a quick drop toward 5,000 USD, or even lower, could be in the cards. Another major support, where stronger bids could be located, is at 3,000 USD, which coincides with the triangle pattern potential.
However, if bulls manage to turn the triangle around, we could see a relief rally, targeting 7,400 USD and potentially 8,400 USD.
Therefore, it is crucial that we keep an eye on how the price will behave over the next few days or weeks and, observe on which side of this triangle Bitcoin will break. This could be the major moment for the upcoming future.
Analysis and opinions provided herein are intended solely for informational and educational purposes and don’t represent a recommendation or an investment advice by TeleTrade. Indiscriminate reliance on illustrative or informational materials may lead to losses.
This article was written by Peter Bukov, one of TeleTrade’s leading analysts.
This article was originally posted on FX Empire
