
 Yahoo Finance
 Boasting A 21% Return On Equity, Is Yandex N.V. (NASDAQ:YNDX) A Top Quality Stock?

While some investors are already well versed in financial metrics (hat tip), this article is for those who would like to learn about Return On Equity (ROE) and why it is important. By way of learning-by-doing, we'll look at ROE to gain a better understanding of Yandex N.V. (NASDAQ:YNDX).
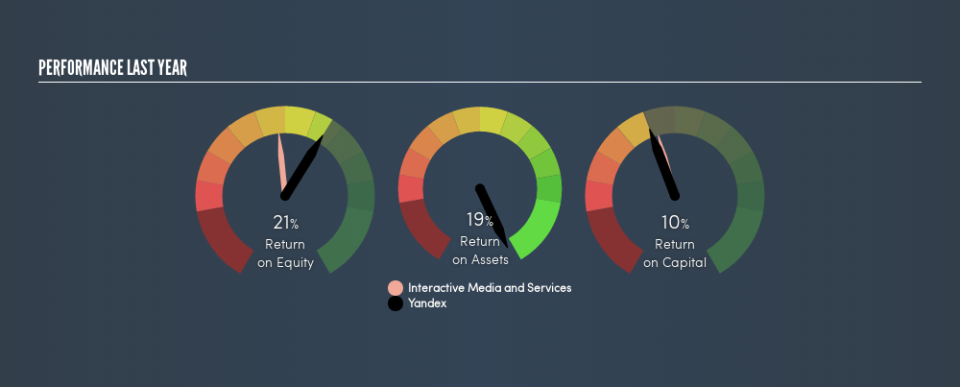
Our data shows Yandex has a return on equity of 21% for the last year. Another way to think of that is that for every $1 worth of equity in the company, it was able to earn $0.21.
Check out our latest analysis for Yandex
How Do I Calculate Return On Equity?
The formula for return on equity is:
Return on Equity = Net Profit ÷ Shareholders' Equity
Or for Yandex:
21% = RUруб48b ÷ RUруб217b (Based on the trailing twelve months to December 2018.)
Most readers would understand what net profit is, but it’s worth explaining the concept of shareholders’ equity. It is the capital paid in by shareholders, plus any retained earnings. You can calculate shareholders' equity by subtracting the company's total liabilities from its total assets.
What Does Return On Equity Signify?
ROE looks at the amount a company earns relative to the money it has kept within the business. The 'return' is the yearly profit. The higher the ROE, the more profit the company is making. So, as a general rule, a high ROE is a good thing. Clearly, then, one can use ROE to compare different companies.
Does Yandex Have A Good ROE?
By comparing a company's ROE with its industry average, we can get a quick measure of how good it is. However, this method is only useful as a rough check, because companies do differ quite a bit within the same industry classification. As you can see in the graphic below, Yandex has a higher ROE than the average (15%) in the Interactive Media and Services industry.
That's clearly a positive. We think a high ROE, alone, is usually enough to justify further research into a company. One data point to check is if insiders have bought shares recently.
The Importance Of Debt To Return On Equity
Most companies need money -- from somewhere -- to grow their profits. That cash can come from issuing shares, retained earnings, or debt. In the case of the first and second options, the ROE will reflect this use of cash, for growth. In the latter case, the use of debt will improve the returns, but will not change the equity. In this manner the use of debt will boost ROE, even though the core economics of the business stay the same.
Combining Yandex's Debt And Its 21% Return On Equity
One positive for shareholders is that Yandex does not have any net debt! Its respectable ROE suggests it is a business worth watching, but it's even better the company achieved this without leverage. After all, when a company has a strong balance sheet, it can often find ways to invest in growth, even if it takes some time.
In Summary
Return on equity is one way we can compare the business quality of different companies. In my book the highest quality companies have high return on equity, despite low debt. All else being equal, a higher ROE is better.
But when a business is high quality, the market often bids it up to a price that reflects this. The rate at which profits are likely to grow, relative to the expectations of profit growth reflected in the current price, must be considered, too. So you might want to take a peek at this data-rich interactive graph of forecasts for the company.
Of course, you might find a fantastic investment by looking elsewhere. So take a peek at this free list of interesting companies.
We aim to bring you long-term focused research analysis driven by fundamental data. Note that our analysis may not factor in the latest price-sensitive company announcements or qualitative material.
If you spot an error that warrants correction, please contact the editor at editorial-team@simplywallst.com. This article by Simply Wall St is general in nature. It does not constitute a recommendation to buy or sell any stock, and does not take account of your objectives, or your financial situation. Simply Wall St has no position in the stocks mentioned. Thank you for reading.
