
 Yahoo Finance
 Brown & Brown's (BRO) Q1 Earnings Top, Revenues Rise Y/Y

Brown & Brown, Inc.’s BRO first-quarter 2023 adjusted earnings of 84 cents per share beat the Zacks Consensus Estimate by 3.7%. The bottom line increased 13.5% year over year.
The quarterly results reflected improved organic growth and higher net investment income, partly offset by higher expenses.
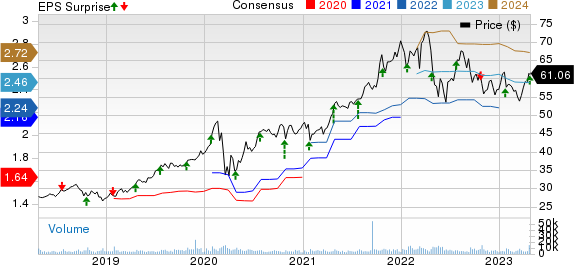
Brown & Brown, Inc. Price, Consensus and EPS Surprise
Brown & Brown, Inc. price-consensus-eps-surprise-chart | Brown & Brown, Inc. Quote
Q1 Details
Total revenues of $1.1 billion beat the Zacks Consensus Estimate by 5.1%. The top line improved 23.6% year over year. The upside can be primarily attributed to commission and fees, which grew 22.5% year over year to $1.1 million.
Organic revenues improved 12.6% to $967.3 million in the quarter under review.
Investment income increased year over year to $7 million from $0.2 million in the year-ago quarter.
Adjusted EBITDAC was $398.2 million, up 23.2% year over year. EBITDAC margin remained flat year over year at 35.7%.
Total expenses increased 28.5% to $821.8 million due to a rise in employee compensation and benefits, other operating expenses, amortization, depreciation and interest expenses.
Financial Update
Brown & Brown exited 2022 with cash and cash equivalents of $563.5 million, down 13.3% from the 2022-end level.
Long-term debt of $3.6 billion as of Mar 31, 2023 slipped 0.3% from 2022 end.
Net cash provided by operating activities in 2022 was $59.8.4 million, down 43.3% year over year.
Dividend Update
The board of directors approved a regular quarterly cash dividend of 11.50 cents per share to be paid out on May 17, 2023, to shareholders of record on May 8, 2023.
Zacks Rank
Brown & Brown currently carries a Zacks Rank #4 (Sell).
You can see the complete list of today’s Zacks #1 Rank (Strong Buy) stocks here.
Performance of Other Insurers
The Travelers Companies TRV reported first-quarter 2022 core income of $4.11 per share, which beat the Zacks Consensus Estimate of $3.64 and our estimate of $3.41. However, the bottom line decreased 2.6% year over year. Travelers’ total revenues increased 10% from the year-ago quarter to $9.7 billion, primarily driven by higher premiums. The top-line figure however missed the Zacks Consensus Estimate of $9.8 billion.
Net written premiums increased 12% year over year to a record $9.4 billion, driven by strong growth across all three segments. The figure was higher than our estimate of $8.9 billion.
Catastrophe losses totaled $422 million, wider than $36 million pre-tax in the prior-year quarter. Catastrophe losses primarily resulted from severe wind and hail storms in multiple states. Travelers witnessed an underwriting gain of $501 million, down 12.9% year over year. The combined ratio deteriorated 410 bps year over year to 95.4
The Progressive Corporation’s PGR first-quarter 2023 earnings per share of 65 cents missed the Zacks Consensus Estimate of $1.44 as well as our estimate of $1.50. The bottom line declined 20.7% year over year.
Operating revenues were about $14.2 billion, up 15.8% year over year. This improvement was driven by a 15% increase in premiums, 18.5% higher fees and other revenues, a 7.1% increase in service revenues and 73.2% higher investment income. The top line exceeded the Zacks Consensus Estimate of $14.1 billion and our estimate of $13.1 billion.
Net premiums earned grew 15% to $13.5 billion and beat our estimate of $12.6 billion. The combined ratio — the percentage of premiums paid out as claims and expenses — deteriorated 450 bps from the prior-year quarter’s level to 99.
RLI Corp. RLI reported first-quarter 2023 operating earnings of $1.63 per share, beating the Zacks Consensus Estimate by 34.7%. The bottom line improved 14% from the prior-year quarter. Operating revenues for the reported quarter were $335 million, up 19.4% year over year, driven by 14.3% higher net premiums earned and 51.5% higher net investment income. The top line however missed the Zacks Consensus Estimate by 2.2%.
Gross premiums written increased 15.6% year over year to $415 million. This uptick can be attributed to the solid performance of the Casualty (up 1%), Property (up 45%) and Surety segments (up 13.6%). Underwriting income of $67.9 million increased 14.1%, primarily due to higher profitability in its Property and Casualty segment. Combined ratio remained flat year over year at 77.9.
Want the latest recommendations from Zacks Investment Research? Today, you can download 7 Best Stocks for the Next 30 Days. Click to get this free report
RLI Corp. (RLI) : Free Stock Analysis Report
The Travelers Companies, Inc. (TRV) : Free Stock Analysis Report
The Progressive Corporation (PGR) : Free Stock Analysis Report
Brown & Brown, Inc. (BRO) : Free Stock Analysis Report
