
 Yahoo Finance
 Bursa Malaysia Berhad's (KLSE:BURSA) investors will be pleased with their 29% return over the last three years
By buying an index fund, investors can approximate the average market return. But if you buy good businesses at attractive prices, your portfolio returns could exceed the average market return. Just take a look at Bursa Malaysia Berhad (KLSE:BURSA), which is up 11%, over three years, soundly beating the market decline of 7.1% (not including dividends). However, more recent returns haven't been as impressive as that, with the stock returning just 9.7% in the last year , including dividends .
So let's investigate and see if the longer term performance of the company has been in line with the underlying business' progress.
Check out our latest analysis for Bursa Malaysia Berhad
While markets are a powerful pricing mechanism, share prices reflect investor sentiment, not just underlying business performance. One flawed but reasonable way to assess how sentiment around a company has changed is to compare the earnings per share (EPS) with the share price.
During three years of share price growth, Bursa Malaysia Berhad achieved compound earnings per share growth of 8.0% per year. This EPS growth is higher than the 3% average annual increase in the share price. Therefore, it seems the market has moderated its expectations for growth, somewhat.
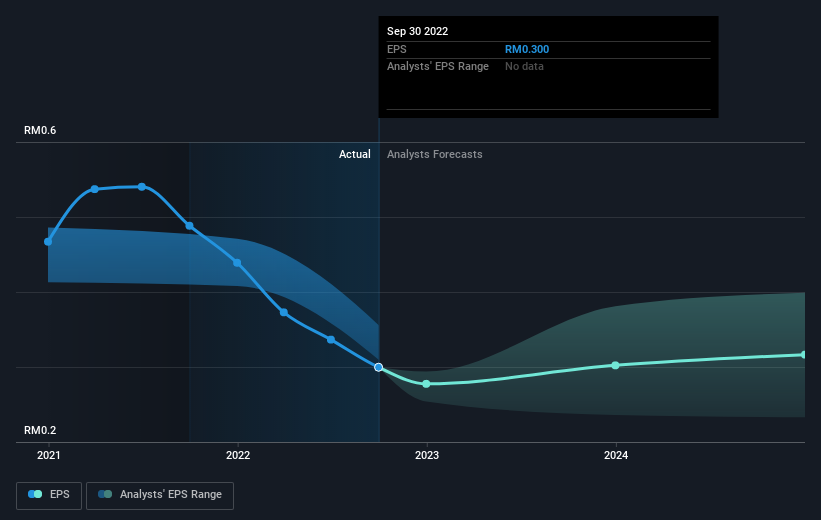
You can see how EPS has changed over time in the image below (click on the chart to see the exact values).
Dive deeper into Bursa Malaysia Berhad's key metrics by checking this interactive graph of Bursa Malaysia Berhad's earnings, revenue and cash flow.
What About Dividends?
As well as measuring the share price return, investors should also consider the total shareholder return (TSR). The TSR is a return calculation that accounts for the value of cash dividends (assuming that any dividend received was reinvested) and the calculated value of any discounted capital raisings and spin-offs. Arguably, the TSR gives a more comprehensive picture of the return generated by a stock. In the case of Bursa Malaysia Berhad, it has a TSR of 29% for the last 3 years. That exceeds its share price return that we previously mentioned. This is largely a result of its dividend payments!
A Different Perspective
We're pleased to report that Bursa Malaysia Berhad shareholders have received a total shareholder return of 9.7% over one year. That's including the dividend. Since the one-year TSR is better than the five-year TSR (the latter coming in at 3% per year), it would seem that the stock's performance has improved in recent times. Someone with an optimistic perspective could view the recent improvement in TSR as indicating that the business itself is getting better with time. While it is well worth considering the different impacts that market conditions can have on the share price, there are other factors that are even more important. For example, we've discovered 2 warning signs for Bursa Malaysia Berhad that you should be aware of before investing here.
Of course Bursa Malaysia Berhad may not be the best stock to buy. So you may wish to see this free collection of growth stocks.
Please note, the market returns quoted in this article reflect the market weighted average returns of stocks that currently trade on MY exchanges.
Have feedback on this article? Concerned about the content? Get in touch with us directly. Alternatively, email editorial-team (at) simplywallst.com.
This article by Simply Wall St is general in nature. We provide commentary based on historical data and analyst forecasts only using an unbiased methodology and our articles are not intended to be financial advice. It does not constitute a recommendation to buy or sell any stock, and does not take account of your objectives, or your financial situation. We aim to bring you long-term focused analysis driven by fundamental data. Note that our analysis may not factor in the latest price-sensitive company announcements or qualitative material. Simply Wall St has no position in any stocks mentioned.
Join A Paid User Research Session
You’ll receive a US$30 Amazon Gift card for 1 hour of your time while helping us build better investing tools for the individual investors like yourself. Sign up here
