
 Yahoo Finance
 Should You Buy Cleveland-Cliffs Inc. (NYSE:CLF) For Its Dividend?

Want to participate in a short research study? Help shape the future of investing tools and you could win a $250 gift card!
Today we'll take a closer look at Cleveland-Cliffs Inc. (NYSE:CLF) from a dividend investor's perspective. Owning a strong business and reinvesting the dividends is widely seen as an attractive way of growing your wealth. If you are hoping to live on the income from dividends, it's important to be a lot more stringent with your investments than the average punter.
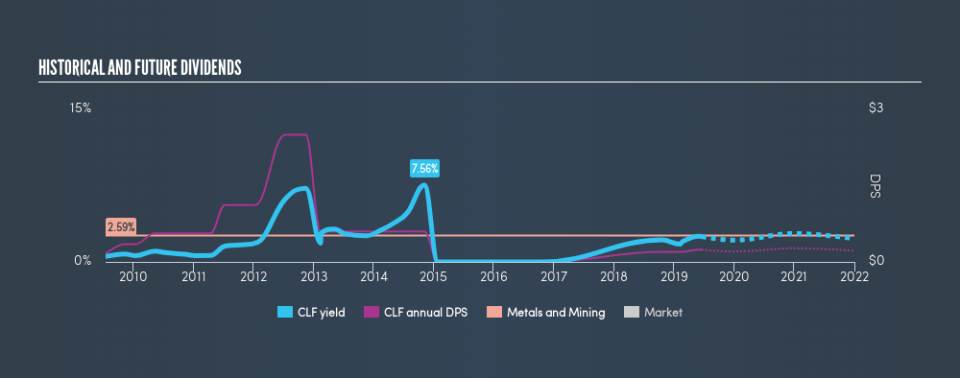
A slim 2.5% yield is hard to get excited about, but the long payment history is respectable. At the right price, or with strong growth opportunities, Cleveland-Cliffs could have potential. The company also bought back stock equivalent to around 6.3% of market capitalisation this year. Some simple analysis can offer a lot of insights when buying a company for its dividend, and we'll go through this below.
Click the interactive chart for our full dividend analysis
Payout ratios
Dividends are typically paid from company earnings. If a company pays more in dividends than it earned, then the dividend might become unsustainable - hardly an ideal situation. So we need to form a view on if a company's dividend is sustainable, relative to its net profit after tax. In the last year, Cleveland-Cliffs paid out 2.9% of its profit as dividends. We like this low payout ratio, because it implies the dividend is well covered and leaves ample opportunity for reinvestment.
In addition to comparing dividends against profits, we should inspect whether the company generated enough cash to pay its dividend. Cleveland-Cliffs paid out 8.7% of its free cash flow as dividends last year, which is conservative and suggests the dividend is sustainable. It's positive to see that Cleveland-Cliffs's dividend is covered by both profits and cash flow, since this is generally a sign that the dividend is sustainable, and a lower payout ratio usually suggests a greater margin of safety before the dividend gets cut.
Is Cleveland-Cliffs's Balance Sheet Risky?
As Cleveland-Cliffs has a meaningful amount of debt, we need to check its balance sheet to see if the company might have debt risks. A rough way to check this is with these two simple ratios: a) net debt divided by EBITDA (earnings before interest, tax, depreciation and amortisation), and b) net interest cover. Net debt to EBITDA is a measure of a company's total debt. Net interest cover measures the ability to meet interest payments on debt. Essentially we check that a) a company does not have too much debt, and b) that it can afford to pay the interest. With net debt of 2.24 times its EBITDA, Cleveland-Cliffs's debt burden is within a normal range for most listed companies.
We calculated its interest cover by measuring its earnings before interest and tax (EBIT), and dividing this by the company's net interest expense. Net interest cover of 5.88 times its interest expense appears reasonable for Cleveland-Cliffs, although we're conscious that even high interest cover doesn't make a company bulletproof.
We update our data on Cleveland-Cliffs every 24 hours, so you can always get our latest analysis of its financial health, here.
Dividend Volatility
From the perspective of an income investor who wants to earn dividends for many years, there is not much point buying a stock if its dividend is regularly cut or is not reliable. For the purpose of this article, we only scrutinise the last decade of Cleveland-Cliffs's dividend payments. The dividend has been cut by more than 20% on at least one occasion historically. During the past ten-year period, the first annual payment was US$0.16 in 2009, compared to US$0.24 last year. This works out to be a compound annual growth rate (CAGR) of approximately 4.1% a year over that time. The dividends haven't grown at precisely 4.1% every year, but this is a useful way to average out the historical rate of growth.
Modest growth in the dividend is good to see, but we think this is offset by historical cuts to the payments. It is hard to live on a dividend income if the company's earnings are not consistent.
Dividend Growth Potential
Given that the dividend has been cut in the past, we need to check if earnings are growing and if that might lead to stronger dividends in the future. Over the past five years, it looks as though Cleveland-Cliffs's EPS have declined at around 9.7% a year. If earnings continue to decline, the dividend may come under pressure. Every investor should make an assessment of whether the company is taking steps to stabilise the situation.
Conclusion
When we look at a dividend stock, we need to form a judgement on whether the dividend will grow, if the company is able to maintain it in a wide range of economic circumstances, and if the dividend payout is sustainable. It's great to see that Cleveland-Cliffs is paying out a low percentage of its earnings and cash flow. Second, earnings per share have been in decline, and its dividend has been cut at least once in the past. In sum, we find it hard to get excited about Cleveland-Cliffs from a dividend perspective. It's not that we think it's a bad business; just that there are other companies that perform better on these criteria.
Without at least some growth in earnings per share over time, the dividend will eventually come under pressure either from costs or inflation. Very few businesses see earnings consistently shrink year after year in perpetuity though, and so it might be worth seeing what the 6 analysts we track are forecasting for the future.
We have also put together a list of global stocks with a market capitalisation above $1bn and yielding more 3%.
We aim to bring you long-term focused research analysis driven by fundamental data. Note that our analysis may not factor in the latest price-sensitive company announcements or qualitative material.
If you spot an error that warrants correction, please contact the editor at editorial-team@simplywallst.com. This article by Simply Wall St is general in nature. It does not constitute a recommendation to buy or sell any stock, and does not take account of your objectives, or your financial situation. Simply Wall St has no position in the stocks mentioned. Thank you for reading.
