
 Yahoo Finance
 Calculating The Fair Value Of The Colonial Motor Company Limited (NZSE:CMO)
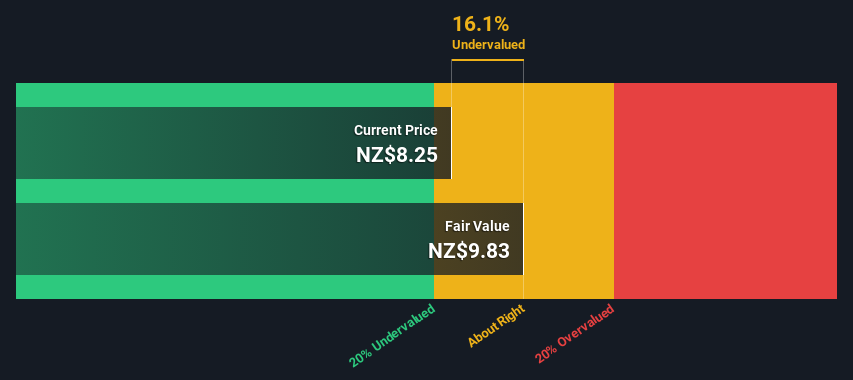
Key Insights
The projected fair value for Colonial Motor is NZ$9.83 based on Dividend Discount Model
Colonial Motor's NZ$8.25 share price indicates it is trading at similar levels as its fair value estimate
Colonial Motor's peers seem to be trading at a higher discount to fair value based onthe industry average of 35%
Today we'll do a simple run through of a valuation method used to estimate the attractiveness of The Colonial Motor Company Limited (NZSE:CMO) as an investment opportunity by taking the expected future cash flows and discounting them to their present value. Our analysis will employ the Discounted Cash Flow (DCF) model. Believe it or not, it's not too difficult to follow, as you'll see from our example!
Companies can be valued in a lot of ways, so we would point out that a DCF is not perfect for every situation. For those who are keen learners of equity analysis, the Simply Wall St analysis model here may be something of interest to you.
See our latest analysis for Colonial Motor
Crunching The Numbers
We have to calculate the value of Colonial Motor slightly differently to other stocks because it is a specialty retail company. Instead of using free cash flows, which are hard to estimate and often not reported by analysts in this industry, dividends per share (DPS) payments are used. This often underestimates the value of a stock, but it can still be good as a comparison to competitors. We use the Gordon Growth Model, which assumes dividend will grow into perpetuity at a rate that can be sustained. The dividend is expected to grow at an annual growth rate equal to the 5-year average of the 10-year government bond yield of 2.6%. We then discount this figure to today's value at a cost of equity of 8.3%. Compared to the current share price of NZ$8.3, the company appears about fair value at a 16% discount to where the stock price trades currently. Remember though, that this is just an approximate valuation, and like any complex formula - garbage in, garbage out.
Value Per Share = Expected Dividend Per Share / (Discount Rate - Perpetual Growth Rate)
= NZ$0.6 / (8.3% – 2.6%)
= NZ$9.8
Important Assumptions
Now the most important inputs to a discounted cash flow are the discount rate, and of course, the actual cash flows. You don't have to agree with these inputs, I recommend redoing the calculations yourself and playing with them. The DCF also does not consider the possible cyclicality of an industry, or a company's future capital requirements, so it does not give a full picture of a company's potential performance. Given that we are looking at Colonial Motor as potential shareholders, the cost of equity is used as the discount rate, rather than the cost of capital (or weighted average cost of capital, WACC) which accounts for debt. In this calculation we've used 8.3%, which is based on a levered beta of 1.260. Beta is a measure of a stock's volatility, compared to the market as a whole. We get our beta from the industry average beta of globally comparable companies, with an imposed limit between 0.8 and 2.0, which is a reasonable range for a stable business.
SWOT Analysis for Colonial Motor
Strength
Debt is well covered by earnings.
Dividend is in the top 25% of dividend payers in the market.
Weakness
Earnings declined over the past year.
Opportunity
Current share price is below our estimate of fair value.
Significant insider buying over the past 3 months.
Lack of analyst coverage makes it difficult to determine CMO's earnings prospects.
Threat
Debt is not well covered by operating cash flow.
Paying a dividend but company has no free cash flows.
Looking Ahead:
Whilst important, the DCF calculation shouldn't be the only metric you look at when researching a company. The DCF model is not a perfect stock valuation tool. Preferably you'd apply different cases and assumptions and see how they would impact the company's valuation. For instance, if the terminal value growth rate is adjusted slightly, it can dramatically alter the overall result. For Colonial Motor, there are three essential items you should consider:
Risks: Take risks, for example - Colonial Motor has 2 warning signs (and 1 which shouldn't be ignored) we think you should know about.
Management:Have insiders been ramping up their shares to take advantage of the market's sentiment for CMO's future outlook? Check out our management and board analysis with insights on CEO compensation and governance factors.
Other High Quality Alternatives: Do you like a good all-rounder? Explore our interactive list of high quality stocks to get an idea of what else is out there you may be missing!
PS. Simply Wall St updates its DCF calculation for every New Zealander stock every day, so if you want to find the intrinsic value of any other stock just search here.
Have feedback on this article? Concerned about the content? Get in touch with us directly. Alternatively, email editorial-team (at) simplywallst.com.
This article by Simply Wall St is general in nature. We provide commentary based on historical data and analyst forecasts only using an unbiased methodology and our articles are not intended to be financial advice. It does not constitute a recommendation to buy or sell any stock, and does not take account of your objectives, or your financial situation. We aim to bring you long-term focused analysis driven by fundamental data. Note that our analysis may not factor in the latest price-sensitive company announcements or qualitative material. Simply Wall St has no position in any stocks mentioned.
