
 Yahoo Finance
 Calculating The Fair Value Of Seeka Limited (NZSE:SEK)
Key Insights
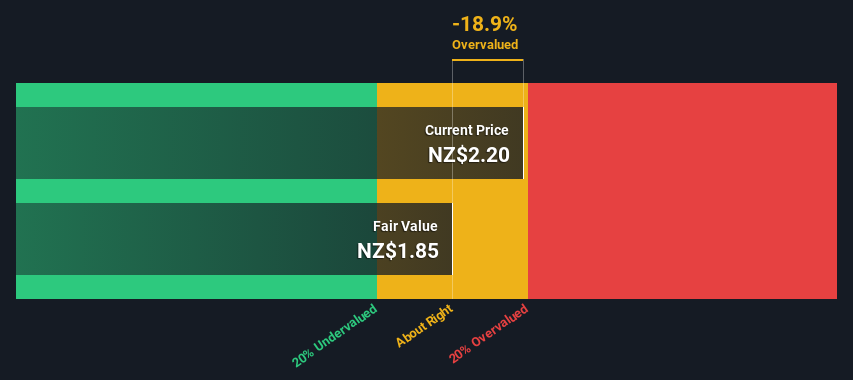
Using the Dividend Discount Model, Seeka fair value estimate is NZ$1.85
Current share price of NZ$2.20 suggests Seeka is potentially trading close to its fair value
The average discount for Seeka's competitorsis currently 66%
In this article we are going to estimate the intrinsic value of Seeka Limited (NZSE:SEK) by taking the forecast future cash flows of the company and discounting them back to today's value. We will use the Discounted Cash Flow (DCF) model on this occasion. Models like these may appear beyond the comprehension of a lay person, but they're fairly easy to follow.
Remember though, that there are many ways to estimate a company's value, and a DCF is just one method. Anyone interested in learning a bit more about intrinsic value should have a read of the Simply Wall St analysis model.
View our latest analysis for Seeka
Step By Step Through The Calculation
As Seeka operates in the food sector, we need to calculate the intrinsic value slightly differently. Instead of using free cash flows, which are hard to estimate and often not reported by analysts in this industry, dividends per share (DPS) payments are used. This often underestimates the value of a stock, but it can still be good as a comparison to competitors. We use the Gordon Growth Model, which assumes dividend will grow into perpetuity at a rate that can be sustained. For a number of reasons a very conservative growth rate is used that cannot exceed that of a company's Gross Domestic Product (GDP). In this case we used the 5-year average of the 10-year government bond yield (2.4%). The expected dividend per share is then discounted to today's value at a cost of equity of 6.4%. Compared to the current share price of NZ$2.2, the company appears around fair value at the time of writing. The assumptions in any calculation have a big impact on the valuation, so it is better to view this as a rough estimate, not precise down to the last cent.
Value Per Share = Expected Dividend Per Share / (Discount Rate - Perpetual Growth Rate)
= NZ$0.07 / (6.4% – 2.4%)
= NZ$1.8
The Assumptions
The calculation above is very dependent on two assumptions. The first is the discount rate and the other is the cash flows. You don't have to agree with these inputs, I recommend redoing the calculations yourself and playing with them. The DCF also does not consider the possible cyclicality of an industry, or a company's future capital requirements, so it does not give a full picture of a company's potential performance. Given that we are looking at Seeka as potential shareholders, the cost of equity is used as the discount rate, rather than the cost of capital (or weighted average cost of capital, WACC) which accounts for debt. In this calculation we've used 6.4%, which is based on a levered beta of 0.800. Beta is a measure of a stock's volatility, compared to the market as a whole. We get our beta from the industry average beta of globally comparable companies, with an imposed limit between 0.8 and 2.0, which is a reasonable range for a stable business.
SWOT Analysis for Seeka
Strength
Debt is well covered by .
Weakness
Interest payments on debt are not well covered.
Opportunity
Has sufficient cash runway for more than 3 years based on current free cash flows.
Good value based on P/S ratio compared to estimated Fair P/S ratio.
Threat
Debt is not well covered by operating cash flow.
Moving On:
Although the valuation of a company is important, it shouldn't be the only metric you look at when researching a company. DCF models are not the be-all and end-all of investment valuation. Preferably you'd apply different cases and assumptions and see how they would impact the company's valuation. For instance, if the terminal value growth rate is adjusted slightly, it can dramatically alter the overall result. For Seeka, we've compiled three pertinent items you should consider:
Risks: As an example, we've found 2 warning signs for Seeka (1 can't be ignored!) that you need to consider before investing here.
Future Earnings: How does SEK's growth rate compare to its peers and the wider market? Dig deeper into the analyst consensus number for the upcoming years by interacting with our free analyst growth expectation chart.
Other High Quality Alternatives: Do you like a good all-rounder? Explore our interactive list of high quality stocks to get an idea of what else is out there you may be missing!
PS. Simply Wall St updates its DCF calculation for every New Zealander stock every day, so if you want to find the intrinsic value of any other stock just search here.
Have feedback on this article? Concerned about the content? Get in touch with us directly. Alternatively, email editorial-team (at) simplywallst.com.
This article by Simply Wall St is general in nature. We provide commentary based on historical data and analyst forecasts only using an unbiased methodology and our articles are not intended to be financial advice. It does not constitute a recommendation to buy or sell any stock, and does not take account of your objectives, or your financial situation. We aim to bring you long-term focused analysis driven by fundamental data. Note that our analysis may not factor in the latest price-sensitive company announcements or qualitative material. Simply Wall St has no position in any stocks mentioned.
