
 Yahoo Finance
 Calculating The Fair Value Of Source Rock Royalties Ltd. (CVE:SRR)
Key Insights
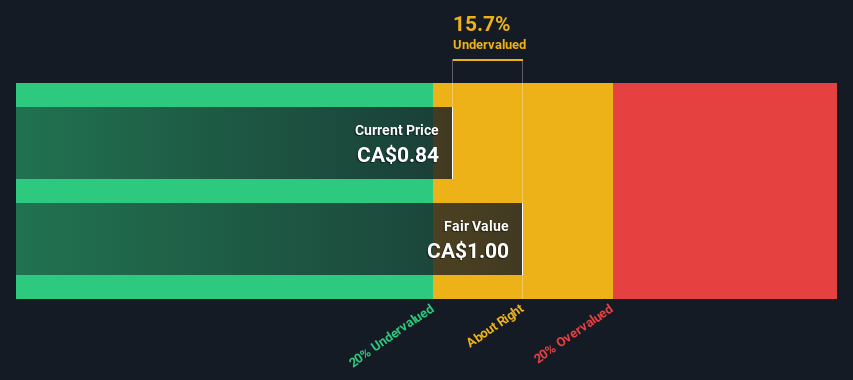
The projected fair value for Source Rock Royalties is CA$1.00 based on Dividend Discount Model
With CA$0.84 share price, Source Rock Royalties appears to be trading close to its estimated fair value
Industry average discount to fair value of 27% suggests Source Rock Royalties' peers are currently trading at a higher discount
Today we will run through one way of estimating the intrinsic value of Source Rock Royalties Ltd. (CVE:SRR) by estimating the company's future cash flows and discounting them to their present value. This will be done using the Discounted Cash Flow (DCF) model. There's really not all that much to it, even though it might appear quite complex.
Remember though, that there are many ways to estimate a company's value, and a DCF is just one method. If you want to learn more about discounted cash flow, the rationale behind this calculation can be read in detail in the Simply Wall St analysis model.
View our latest analysis for Source Rock Royalties
The Model
As Source Rock Royalties operates in the oil and gas sector, we need to calculate the intrinsic value slightly differently. In this approach dividends per share (DPS) are used, as free cash flow is difficult to estimate and often not reported by analysts. Unless a company pays out the majority of its FCF as a dividend, this method will typically underestimate the value of the stock. The 'Gordon Growth Model' is used, which simply assumes that dividend payments will continue to increase at a sustainable growth rate forever. The dividend is expected to grow at an annual growth rate equal to the 5-year average of the 10-year government bond yield of 2.0%. We then discount this figure to today's value at a cost of equity of 8.3%. Compared to the current share price of CA$0.8, the company appears about fair value at a 16% discount to where the stock price trades currently. The assumptions in any calculation have a big impact on the valuation, so it is better to view this as a rough estimate, not precise down to the last cent.
Value Per Share = Expected Dividend Per Share / (Discount Rate - Perpetual Growth Rate)
= CA$0.07 / (8.3% – 2.0%)
= CA$1.0
The Assumptions
Now the most important inputs to a discounted cash flow are the discount rate, and of course, the actual cash flows. If you don't agree with these result, have a go at the calculation yourself and play with the assumptions. The DCF also does not consider the possible cyclicality of an industry, or a company's future capital requirements, so it does not give a full picture of a company's potential performance. Given that we are looking at Source Rock Royalties as potential shareholders, the cost of equity is used as the discount rate, rather than the cost of capital (or weighted average cost of capital, WACC) which accounts for debt. In this calculation we've used 8.3%, which is based on a levered beta of 1.366. Beta is a measure of a stock's volatility, compared to the market as a whole. We get our beta from the industry average beta of globally comparable companies, with an imposed limit between 0.8 and 2.0, which is a reasonable range for a stable business.
SWOT Analysis for Source Rock Royalties
Strength
Currently debt free.
Dividend is in the top 25% of dividend payers in the market.
Weakness
Earnings declined over the past year.
Opportunity
Current share price is below our estimate of fair value.
Lack of analyst coverage makes it difficult to determine SRR's earnings prospects.
Threat
Dividends are not covered by earnings.
Next Steps:
Whilst important, the DCF calculation ideally won't be the sole piece of analysis you scrutinize for a company. It's not possible to obtain a foolproof valuation with a DCF model. Rather it should be seen as a guide to "what assumptions need to be true for this stock to be under/overvalued?" For example, changes in the company's cost of equity or the risk free rate can significantly impact the valuation. For Source Rock Royalties, we've compiled three additional factors you should assess:
Risks: For example, we've discovered 5 warning signs for Source Rock Royalties (2 are a bit unpleasant!) that you should be aware of before investing here.
Management:Have insiders been ramping up their shares to take advantage of the market's sentiment for SRR's future outlook? Check out our management and board analysis with insights on CEO compensation and governance factors.
Other High Quality Alternatives: Do you like a good all-rounder? Explore our interactive list of high quality stocks to get an idea of what else is out there you may be missing!
PS. Simply Wall St updates its DCF calculation for every Canadian stock every day, so if you want to find the intrinsic value of any other stock just search here.
Have feedback on this article? Concerned about the content? Get in touch with us directly. Alternatively, email editorial-team (at) simplywallst.com.
This article by Simply Wall St is general in nature. We provide commentary based on historical data and analyst forecasts only using an unbiased methodology and our articles are not intended to be financial advice. It does not constitute a recommendation to buy or sell any stock, and does not take account of your objectives, or your financial situation. We aim to bring you long-term focused analysis driven by fundamental data. Note that our analysis may not factor in the latest price-sensitive company announcements or qualitative material. Simply Wall St has no position in any stocks mentioned.
