
 Yahoo Finance
 Capital Allocation Trends At Avillion Berhad (KLSE:AVI) Aren't Ideal
Ignoring the stock price of a company, what are the underlying trends that tell us a business is past the growth phase? When we see a declining return on capital employed (ROCE) in conjunction with a declining base of capital employed, that's often how a mature business shows signs of aging. Ultimately this means that the company is earning less per dollar invested and on top of that, it's shrinking its base of capital employed. So after glancing at the trends within Avillion Berhad (KLSE:AVI), we weren't too hopeful.
Return On Capital Employed (ROCE): What Is It?
For those who don't know, ROCE is a measure of a company's yearly pre-tax profit (its return), relative to the capital employed in the business. To calculate this metric for Avillion Berhad, this is the formula:
Return on Capital Employed = Earnings Before Interest and Tax (EBIT) ÷ (Total Assets - Current Liabilities)
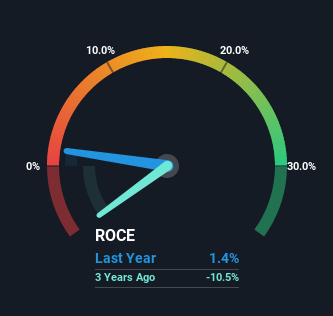
0.014 = RM4.3m ÷ (RM358m - RM57m) (Based on the trailing twelve months to September 2022).
So, Avillion Berhad has an ROCE of 1.4%. In absolute terms, that's a low return and it also under-performs the Hospitality industry average of 4.7%.
See our latest analysis for Avillion Berhad
While the past is not representative of the future, it can be helpful to know how a company has performed historically, which is why we have this chart above. If you'd like to look at how Avillion Berhad has performed in the past in other metrics, you can view this free graph of past earnings, revenue and cash flow.
So How Is Avillion Berhad's ROCE Trending?
In terms of Avillion Berhad's historical ROCE movements, the trend doesn't inspire confidence. Unfortunately the returns on capital have diminished from the 3.4% that they were earning five years ago. On top of that, it's worth noting that the amount of capital employed within the business has remained relatively steady. This combination can be indicative of a mature business that still has areas to deploy capital, but the returns received aren't as high due potentially to new competition or smaller margins. If these trends continue, we wouldn't expect Avillion Berhad to turn into a multi-bagger.
The Bottom Line On Avillion Berhad's ROCE
All in all, the lower returns from the same amount of capital employed aren't exactly signs of a compounding machine. We expect this has contributed to the stock plummeting 72% during the last five years. That being the case, unless the underlying trends revert to a more positive trajectory, we'd consider looking elsewhere.
Avillion Berhad does come with some risks though, we found 2 warning signs in our investment analysis, and 1 of those is a bit concerning...
While Avillion Berhad may not currently earn the highest returns, we've compiled a list of companies that currently earn more than 25% return on equity. Check out this free list here.
Have feedback on this article? Concerned about the content? Get in touch with us directly. Alternatively, email editorial-team (at) simplywallst.com.
This article by Simply Wall St is general in nature. We provide commentary based on historical data and analyst forecasts only using an unbiased methodology and our articles are not intended to be financial advice. It does not constitute a recommendation to buy or sell any stock, and does not take account of your objectives, or your financial situation. We aim to bring you long-term focused analysis driven by fundamental data. Note that our analysis may not factor in the latest price-sensitive company announcements or qualitative material. Simply Wall St has no position in any stocks mentioned.
Join A Paid User Research Session
You’ll receive a US$30 Amazon Gift card for 1 hour of your time while helping us build better investing tools for the individual investors like yourself. Sign up here
