
 Yahoo Finance
 Carlsberg A/S's Dividend Analysis
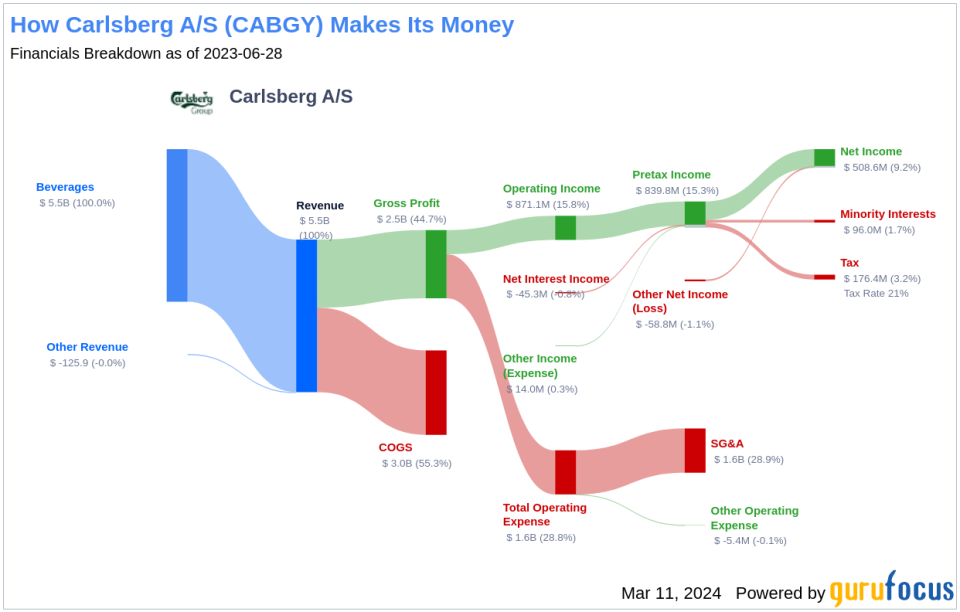
Assessing the Dividend Performance of Carlsberg A/S (CABGY)
Carlsberg A/S (CABGY) recently announced a dividend of $0.78 per share, payable on 2024-03-21, with the ex-dividend date set for 2024-03-12. As investors look forward to this upcoming payment, the spotlight also shines on the company's dividend history, yield, and growth rates. Using the data from GuruFocus, let's look into Carlsberg A/S's dividend performance and assess its sustainability.
What Does Carlsberg A/S Do?
This Powerful Chart Made Peter Lynch 29% A Year For 13 Years
How to calculate the intrinsic value of a stock?
Carlsberg is the fourth-largest brewer in the world following the combination of Anheuser-Busch InBev and SABMiller, with major operations in Russia, Europe, and Asia. It holds leading share in Scandinavia, Switzerland, Portugal, Laos, Nepal, and parts of western China. Its key brands include Carlsberg, 1664, Tuborg, Holsten, and Somersby. The company's 2022 beverage volume, excluding Russia, was split among Northern and Western Europe (35%), Eastern Europe (26%), and Asia (39%).
A Glimpse at Carlsberg A/S's Dividend History
Carlsberg A/S has maintained a consistent dividend payment record since 2010. Dividends are currently distributed on a yearly basis. Carlsberg A/S has increased its dividend each year since 2010. The stock is thus listed as a dividend achiever, an honor that is given to companies that have increased their dividend each year for at least the past 14 years. Below is a chart showing annual Dividends Per Share for tracking historical trends.

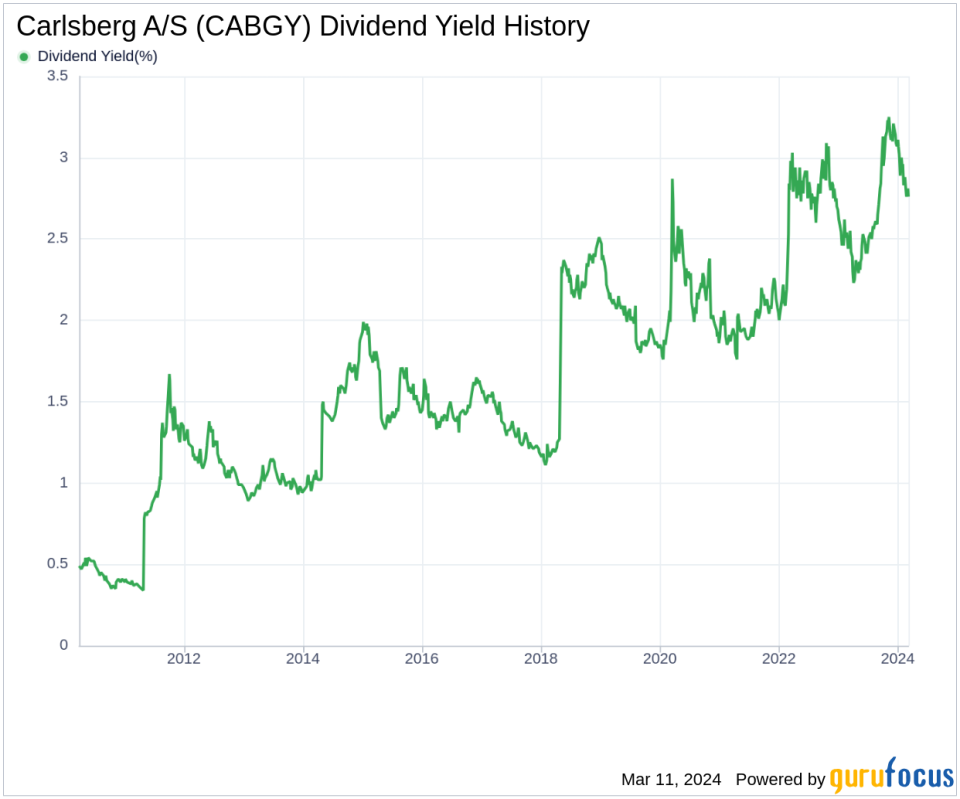
Breaking Down Carlsberg A/S's Dividend Yield and Growth
As of today, Carlsberg A/S currently has a 12-month trailing dividend yield of 2.79% and a 12-month forward dividend yield of 2.83%. This suggests an expectation of increased dividend payments over the next 12 months.
Over the past three years, Carlsberg A/S's annual dividend growth rate was 8.70%. Extended to a five-year horizon, this rate increased to 10.60% per year. And over the past decade, Carlsberg A/S's annual dividends per share growth rate stands at an impressive 16.60%.
Based on Carlsberg A/S's dividend yield and five-year growth rate, the 5-year yield on cost of Carlsberg A/S stock as of today is approximately 4.62%.
The Sustainability Question: Payout Ratio and Profitability
To assess the sustainability of the dividend, one needs to evaluate the company's payout ratio. The dividend payout ratio provides insights into the portion of earnings the company distributes as dividends. A lower ratio suggests that the company retains a significant part of its earnings, thereby ensuring the availability of funds for future growth and unexpected downturns. As of 2023-12-31, Carlsberg A/S's dividend payout ratio is 0.49.
Carlsberg A/S's profitability rank, offers an understanding of the company's earnings prowess relative to its peers. GuruFocus ranks Carlsberg A/S's profitability 6 out of 10 as of 2023-12-31, suggesting fair profitability. The company has reported net profit in 7 years out of the past 10 years.
Growth Metrics: The Future Outlook
To ensure the sustainability of dividends, a company must have robust growth metrics. Carlsberg A/S's growth rank of 6 out of 10 suggests that the company has a fair growth outlook.
Revenue is the lifeblood of any company, and Carlsberg A/S's revenue per share, combined with the 3-year revenue growth rate, indicates a strong revenue model. Carlsberg A/S's revenue has increased by approximately 10.60% per year on average, a rate that outperforms approximately 63.45% of global competitors.
The company's 3-year EPS growth rate showcases its capability to grow its earnings, a critical component for sustaining dividends in the long run. During the past three years, Carlsberg A/S's earnings increased by approximately 8.20% per year on average, a rate that outperforms approximately 40.7% of global competitors.
Lastly, the company's 5-year EBITDA growth rate of 8.00%, which outperforms approximately 52.07% of global competitors.
Next Steps
In conclusion, Carlsberg A/S's consistent dividend payments, along with a strong dividend growth rate, suggest a shareholder-friendly approach. The company's moderate payout ratio and fair profitability indicate a balanced strategy between rewarding investors and retaining earnings for future growth. The growth metrics, including revenue and earnings growth, further support the likelihood of sustained dividend payments. Investors looking for dividend-paying stocks with a history of growth may find Carlsberg A/S an appealing option. However, it is essential to consider the broader market and industry trends when making investment decisions. How will Carlsberg A/S adapt to shifting consumer preferences and regulatory landscapes? Will its strategic initiatives continue to support dividend growth? These are critical questions for value investors considering Carlsberg A/S as a long-term investment.
GuruFocus Premium users can screen for high-dividend yield stocks using the High Dividend Yield Screener.
This article, generated by GuruFocus, is designed to provide general insights and is not tailored financial advice. Our commentary is rooted in historical data and analyst projections, utilizing an impartial methodology, and is not intended to serve as specific investment guidance. It does not formulate a recommendation to purchase or divest any stock and does not consider individual investment objectives or financial circumstances. Our objective is to deliver long-term, fundamental data-driven analysis. Be aware that our analysis might not incorporate the most recent, price-sensitive company announcements or qualitative information. GuruFocus holds no position in the stocks mentioned herein.
This article first appeared on GuruFocus.
