
 Yahoo Finance
 Should We Be Cautious About Nexa Resources S.A.'s (NYSE:NEXA) ROE Of 9.9%?
One of the best investments we can make is in our own knowledge and skill set. With that in mind, this article will work through how we can use Return On Equity (ROE) to better understand a business. By way of learning-by-doing, we'll look at ROE to gain a better understanding of Nexa Resources S.A. (NYSE:NEXA).
ROE or return on equity is a useful tool to assess how effectively a company can generate returns on the investment it received from its shareholders. Simply put, it is used to assess the profitability of a company in relation to its equity capital.
See our latest analysis for Nexa Resources
How To Calculate Return On Equity?
Return on equity can be calculated by using the formula:
Return on Equity = Net Profit (from continuing operations) ÷ Shareholders' Equity
So, based on the above formula, the ROE for Nexa Resources is:
9.9% = US$171m ÷ US$1.7b (Based on the trailing twelve months to June 2021).
The 'return' is the amount earned after tax over the last twelve months. So, this means that for every $1 of its shareholder's investments, the company generates a profit of $0.10.
Does Nexa Resources Have A Good ROE?
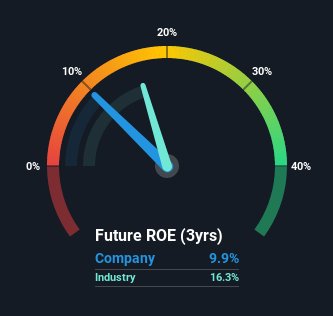
By comparing a company's ROE with its industry average, we can get a quick measure of how good it is. However, this method is only useful as a rough check, because companies do differ quite a bit within the same industry classification. If you look at the image below, you can see Nexa Resources has a lower ROE than the average (16%) in the Metals and Mining industry classification.
That's not what we like to see. Although, we think that a lower ROE could still mean that a company has the opportunity to better its returns with the use of leverage, provided its existing debt levels are low. A high debt company having a low ROE is a different story altogether and a risky investment in our books. You can see the 3 risks we have identified for Nexa Resources by visiting our risks dashboard for free on our platform here.
How Does Debt Impact ROE?
Companies usually need to invest money to grow their profits. That cash can come from retained earnings, issuing new shares (equity), or debt. In the case of the first and second options, the ROE will reflect this use of cash, for growth. In the latter case, the debt required for growth will boost returns, but will not impact the shareholders' equity. Thus the use of debt can improve ROE, albeit along with extra risk in the case of stormy weather, metaphorically speaking.
Nexa Resources' Debt And Its 9.9% ROE
It's worth noting the high use of debt by Nexa Resources, leading to its debt to equity ratio of 1.10. The combination of a rather low ROE and significant use of debt is not particularly appealing. Investors should think carefully about how a company might perform if it was unable to borrow so easily, because credit markets do change over time.
Conclusion
Return on equity is one way we can compare its business quality of different companies. A company that can achieve a high return on equity without debt could be considered a high quality business. If two companies have around the same level of debt to equity, and one has a higher ROE, I'd generally prefer the one with higher ROE.
But ROE is just one piece of a bigger puzzle, since high quality businesses often trade on high multiples of earnings. Profit growth rates, versus the expectations reflected in the price of the stock, are a particularly important to consider. So you might want to check this FREE visualization of analyst forecasts for the company.
Of course Nexa Resources may not be the best stock to buy. So you may wish to see this free collection of other companies that have high ROE and low debt.
This article by Simply Wall St is general in nature. We provide commentary based on historical data and analyst forecasts only using an unbiased methodology and our articles are not intended to be financial advice. It does not constitute a recommendation to buy or sell any stock, and does not take account of your objectives, or your financial situation. We aim to bring you long-term focused analysis driven by fundamental data. Note that our analysis may not factor in the latest price-sensitive company announcements or qualitative material. Simply Wall St has no position in any stocks mentioned.
Have feedback on this article? Concerned about the content? Get in touch with us directly. Alternatively, email editorial-team (at) simplywallst.com.
