
 Yahoo Finance
 Has The Charles Schwab Corporation (NYSE:SCHW) Improved Earnings Growth In Recent Times?

After looking at The Charles Schwab Corporation’s (NYSE:SCHW) latest earnings announcement (31 March 2018), I found it useful to revisit the company’s performance in the past couple of years and assess this against the most recent figures. As a long-term investor I tend to focus on earnings trend, rather than a single number at one point in time. Also, comparing it against an industry benchmark to understand whether it outperformed, or is simply riding an industry wave, is a crucial aspect. Below is a brief commentary on my key takeaways. See our latest analysis for Charles Schwab
Were SCHW’s earnings stronger than its past performances and the industry?
I prefer to use the ‘latest twelve-month’ data, which annualizes the most recent half-year data, or in some cases, the latest annual report is already the most recent financial year data. This blend allows me to examine different companies on a similar basis, using new information. For Charles Schwab, its most recent bottom-line (trailing twelve month) is US$2.40B, which compared to the prior year’s level, has increased by 27.78%. Given that these figures are somewhat short-term, I have calculated an annualized five-year figure for Charles Schwab’s net income, which stands at US$1.30B This shows that, on average, Charles Schwab has been able to consistently improve its earnings over the last few years as well.
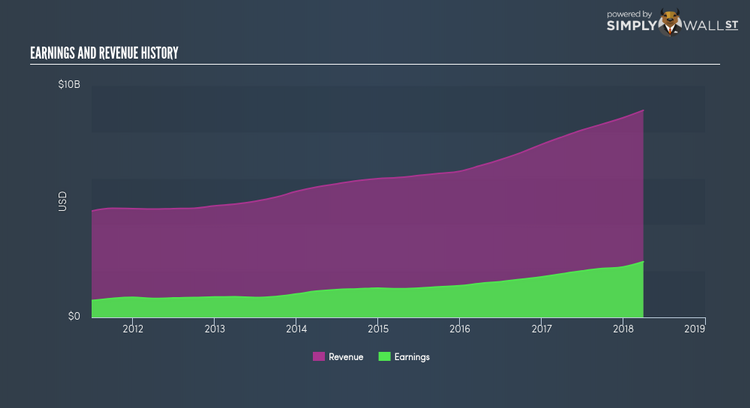
What’s enabled this growth? Well, let’s take a look at whether it is only owing to industry tailwinds, or if Charles Schwab has seen some company-specific growth. Over the last few years, Charles Schwab grew its bottom line faster than revenue by successfully controlling its costs. This brought about a margin expansion and profitability over time. Viewing growth from a sector-level, the US capital markets industry has been growing its average earnings by double-digit 14.43% over the previous year, and 12.90% over the past five years. This shows that whatever tailwind the industry is gaining from, Charles Schwab is able to amplify this to its advantage.
What does this mean?
While past data is useful, it doesn’t tell the whole story. While Charles Schwab has a good historical track record with positive growth and profitability, there’s no certainty that this will extrapolate into the future. I suggest you continue to research Charles Schwab to get a better picture of the stock by looking at:
Future Outlook: What are well-informed industry analysts predicting for SCHW’s future growth? Take a look at our free research report of analyst consensus for SCHW’s outlook.
Financial Health: Is SCHW’s operations financially sustainable? Balance sheets can be hard to analyze, which is why we’ve done it for you. Check out our financial health checks here.
Other High-Performing Stocks: Are there other stocks that provide better prospects with proven track records? Explore our free list of these great stocks here.
NB: Figures in this article are calculated using data from the trailing twelve months from 31 March 2018. This may not be consistent with full year annual report figures.
To help readers see pass the short term volatility of the financial market, we aim to bring you a long-term focused research analysis purely driven by fundamental data. Note that our analysis does not factor in the latest price sensitive company announcements.
The author is an independent contributor and at the time of publication had no position in the stocks mentioned.
